
Insights on measuring, analysing and improving.
Stay up to date with the latest trends and developments. From practice, from our clients and from our own team.
 Success story
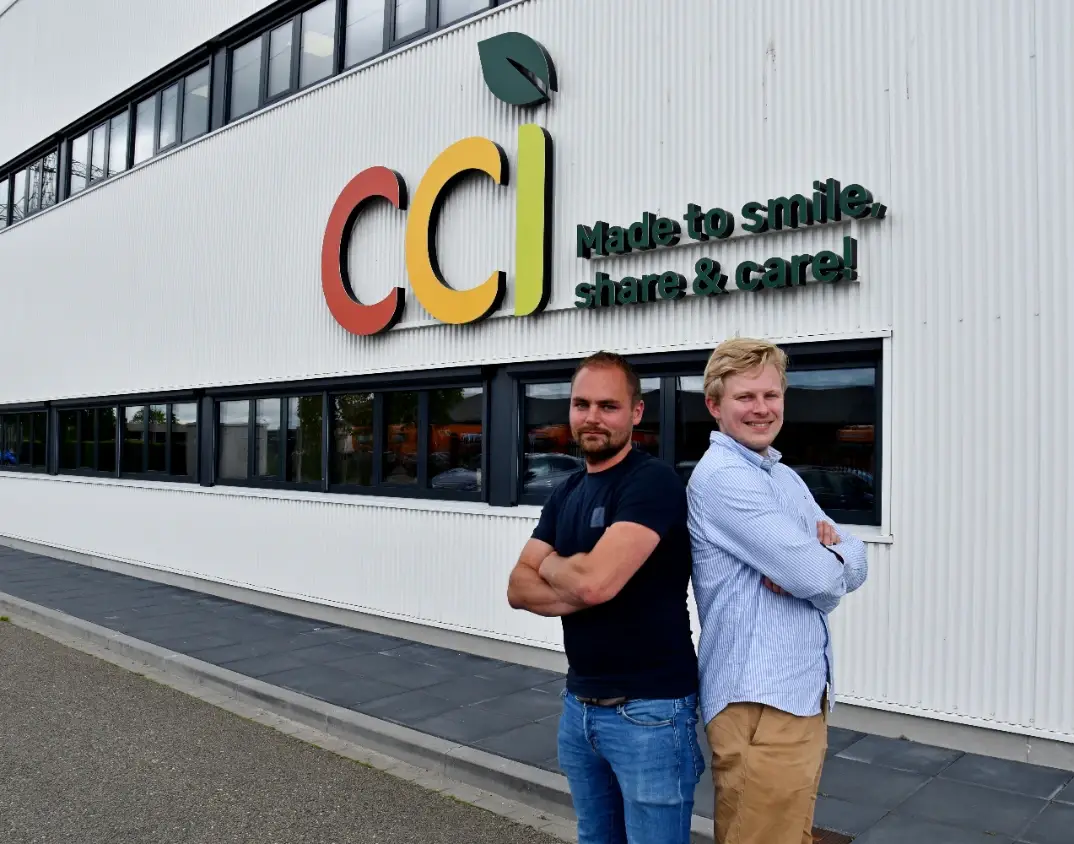
“Thanks to VDS, CCI now steers on the basis of real data.”
The complete customer story of CCI, told by operations manager Marten Groen and business controller Alwin Seinen. From paper fault forms to daily steering on real-time figures.
Read the testimonial →All articles
 Success story
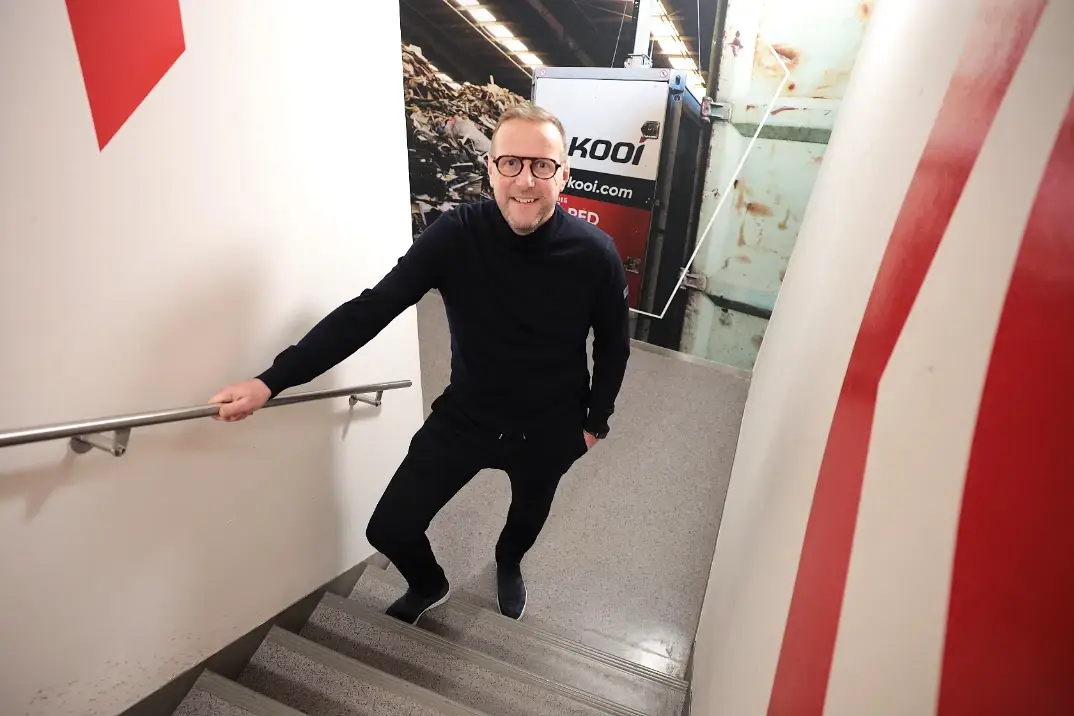
“For us, VDS is a strategic partner at the interface of business and data.”
The complete customer story of Kooi, told by CBO Marco Banning, business controller Marcel Teunissen and adviser Erik Kort.
Read the testimonial → Knowledge base
Calculating OEE: formula, explanation and a worked example
You calculate OEE (Overall Equipment Effectiveness) by multiplying three factors: availability × performance × quality.
Read more → Knowledge base
OEE calculator: enter your shift and see where the loss is
Calculate your OEE online from six numbers per shift. The calculator shows availability, performance and quality separately, plus where the biggest loss is.
Read more → Knowledge base
Calculating cycle time: formula and example
You calculate cycle time by dividing the net available production time by the number of units produced: cycle time = available production time ÷ number produced.
Read more →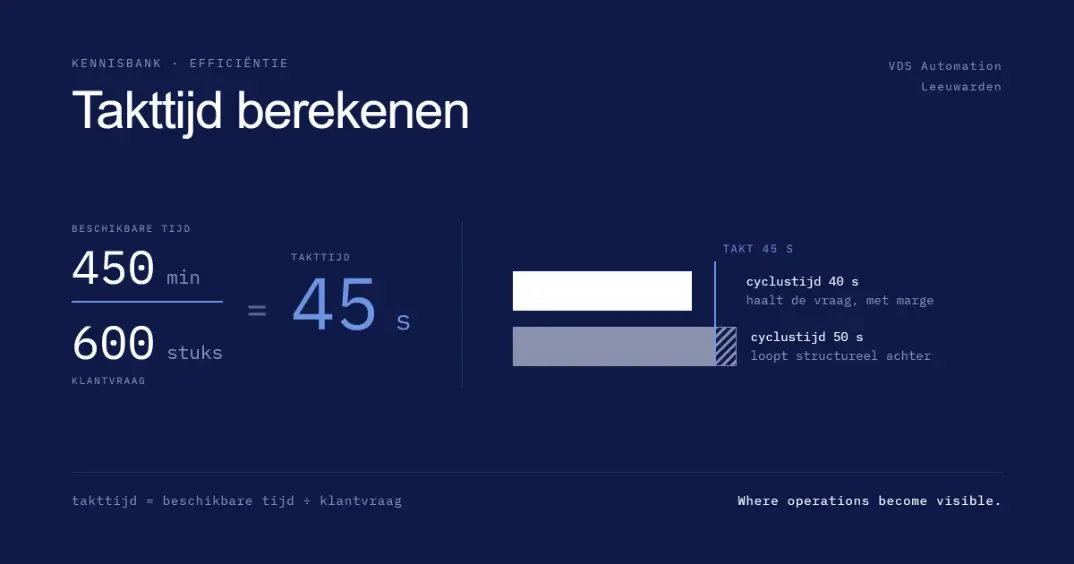 Knowledge base
Calculating takt time: formula and example
You calculate takt time by dividing the available production time by customer demand in the same period: takt time = available time ÷ customer demand.
Read more → Knowledge base
Bottleneck analysis: finding the constraint step
A bottleneck analysis determines which process step limits the output of the whole line: the step with the lowest effective capacity or the longest cycle time.
Read more →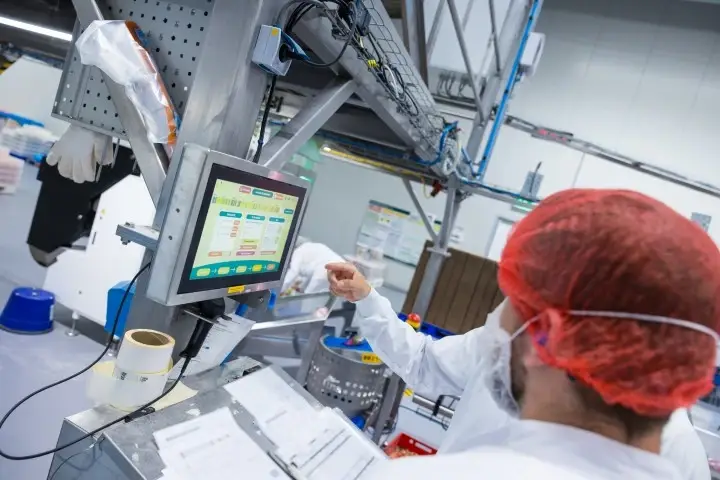 Knowledge base
Recording downtime: how to make lost time visible
You record downtime by logging every stop with its duration, time and cause, split into planned and unplanned downtime.
Read more →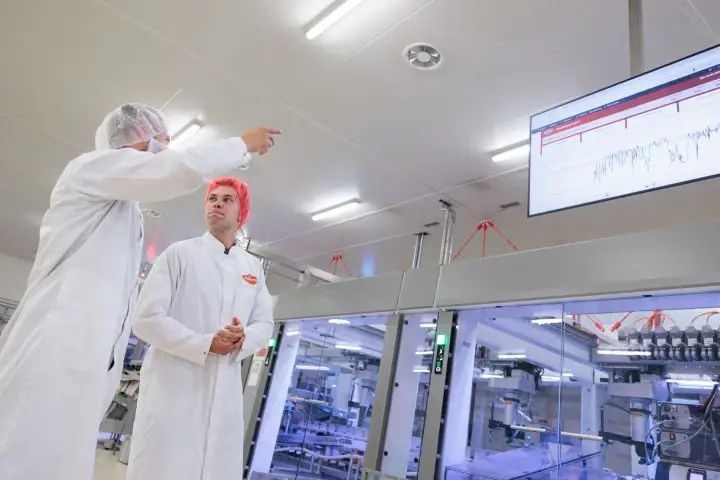 Knowledge base
Taking a baseline measurement and proving the impact
A baseline measurement is the recorded starting situation before an improvement; you prove the effect by measuring again after the intervention under equal conditions and the difference…
Read more → Knowledge base
Applying PDCA with production data
PDCA (Plan-Do-Check-Act) with production data means you back every phase with measured figures instead of assumptions: plan on a baseline measurement, do, check against that same…
Read more →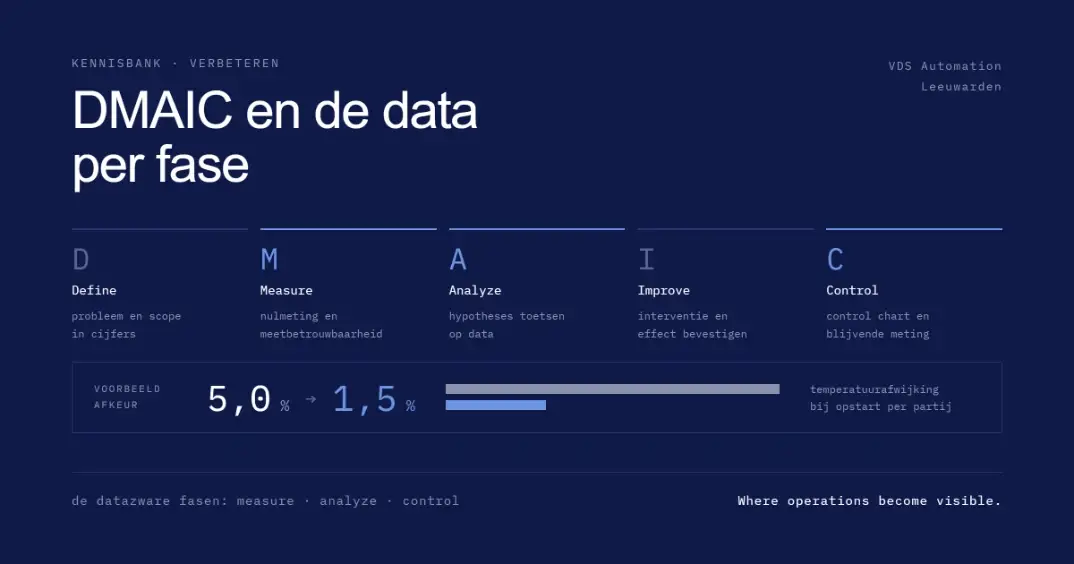 Knowledge base
DMAIC: which data belongs to each phase
DMAIC (Define, Measure, Analyze, Improve, Control) attaches a concrete data question to each phase: define the problem in figures, measure the baseline, analyse causes with data,…
Read more → Knowledge base
Backing a gemba walk with data
You back a gemba walk with data by looking at the current figures per line before the floor round and testing during the round what explains those figures.
Read more → Knowledge base
Calculating sigma level from DPMO
You calculate the sigma level from the number of defects per million opportunities (DPMO): DPMO = (defects ÷ (units × opportunities)) × 1,000,000, which you convert into a sigma level using a sigma table.
Read more →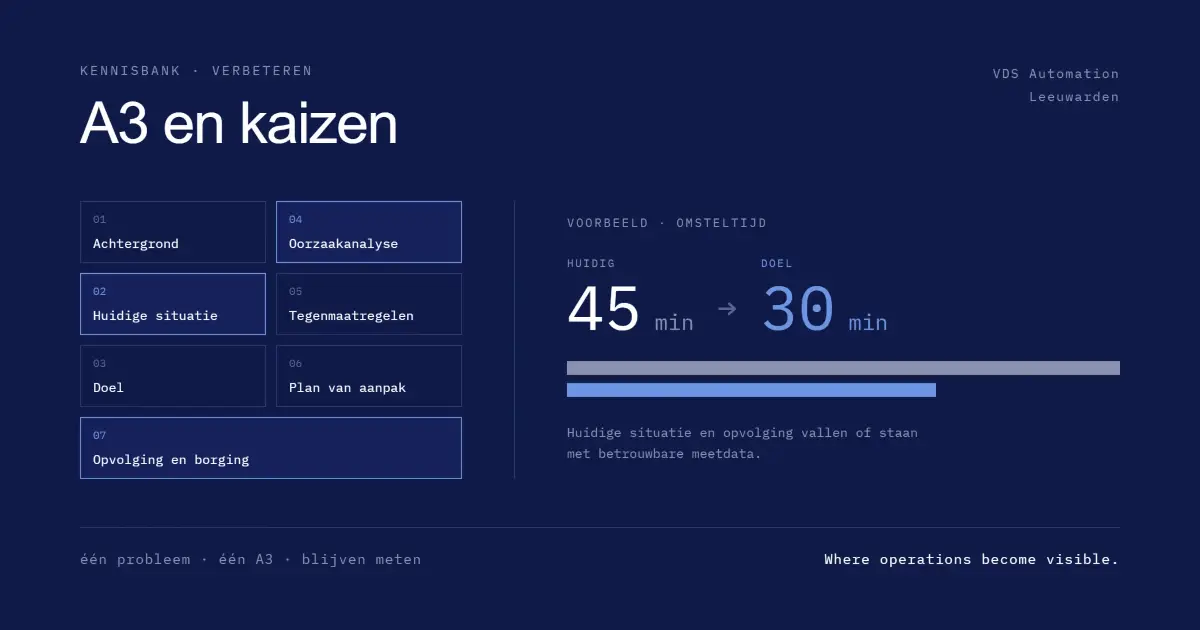 Knowledge base
A3 and kaizen: improving in a structured way
An A3 is a structured problem-solving document on a single A3 sheet, background, current situation, goal, analysis, measures, plan and follow-up; kaizen is the continuous stream of small…
Read more → Knowledge base
Setting up an improvement programme with data
An improvement programme with data goes through five steps: measure the baseline, use the figures to pick the largest source of loss, carry out one targeted intervention, prove the effect against the…
Read more →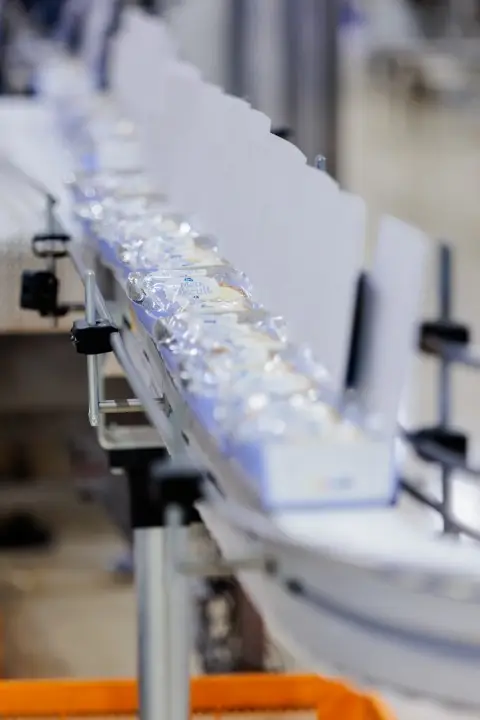 Knowledge base
Batch traceability: tracking batches fully backwards and forwards
Batch traceability is being able to track a batch fully backwards and forwards through the whole process: from which raw material batches went into it to which finished products…
Read more →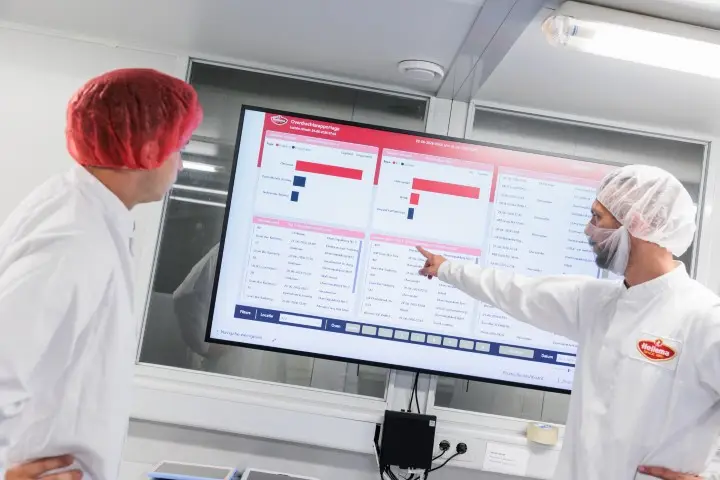 Knowledge base
Audit-ready for BRCGS, IFS and FSSC 22000
Being audit-ready for BRCGS, IFS or FSSC 22000 means you can demonstrate at any moment that your process is under control: that your critical control points (CCPs), process parameters and deviations…
Read more →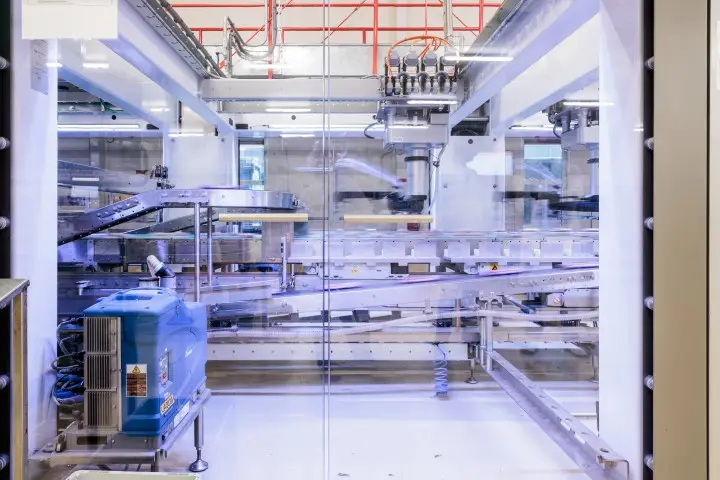 Knowledge base
CAPA and root cause analysis
CAPA (Corrective and Preventive Action) is the structured removal of the cause of a deviation and the prevention of its return; root cause analysis is the step that finds the actual…
Read more →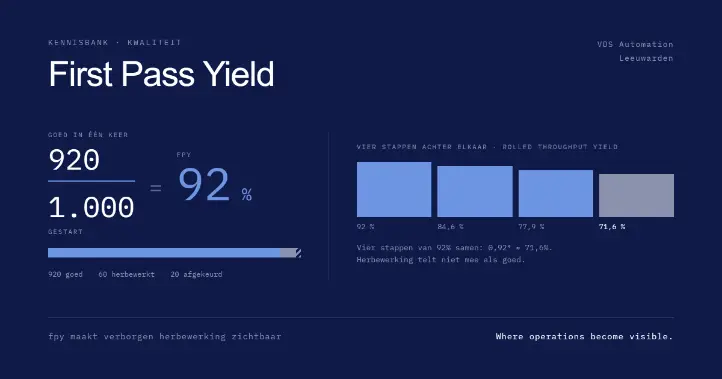 Knowledge base
Calculating First Pass Yield (FPY)
You calculate First Pass Yield (FPY) by dividing the number of units produced right first time by the total number of units started: FPY = right-first-time ÷ started.
Read more →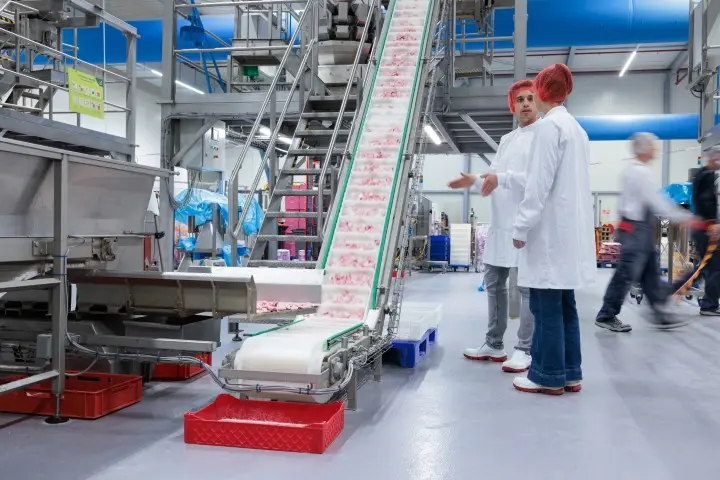 Knowledge base
Process limits and drift: spotting deviation before scrap
Process limits are the upper and lower bound within which a process parameter may vary; drift is that parameter gradually running towards a limit, something that with continuous…
Read more → Knowledge base
Dutch energy-saving obligation: does it apply to you and what do you have to do?
Compulsory in the Netherlands from 50,000 kWh or 25,000 m³ of gas per site: take every measure that pays for itself within the payback period.
Read more → Knowledge base
EED audit obligation and ISO 50001: what applies from when?
In the Netherlands an energy audit obligation applies from 10 TJ per year, and above 85 TJ a certified energy management system. The criterion is consumption, not company size.
Read more →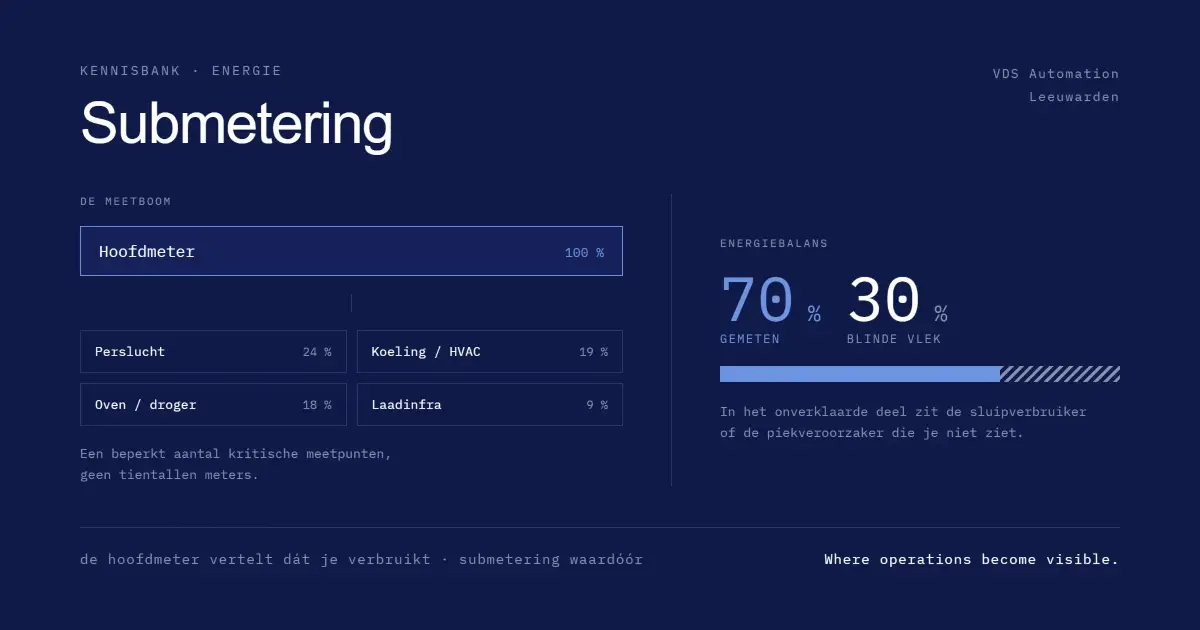 Knowledge base
Submetering: from total consumption to explanatory insight
Submetering is the measurement of energy consumption at sub-level, per installation, line, machine or department, below the main meter, so that you see where consumption and peaks arise in…
Read more →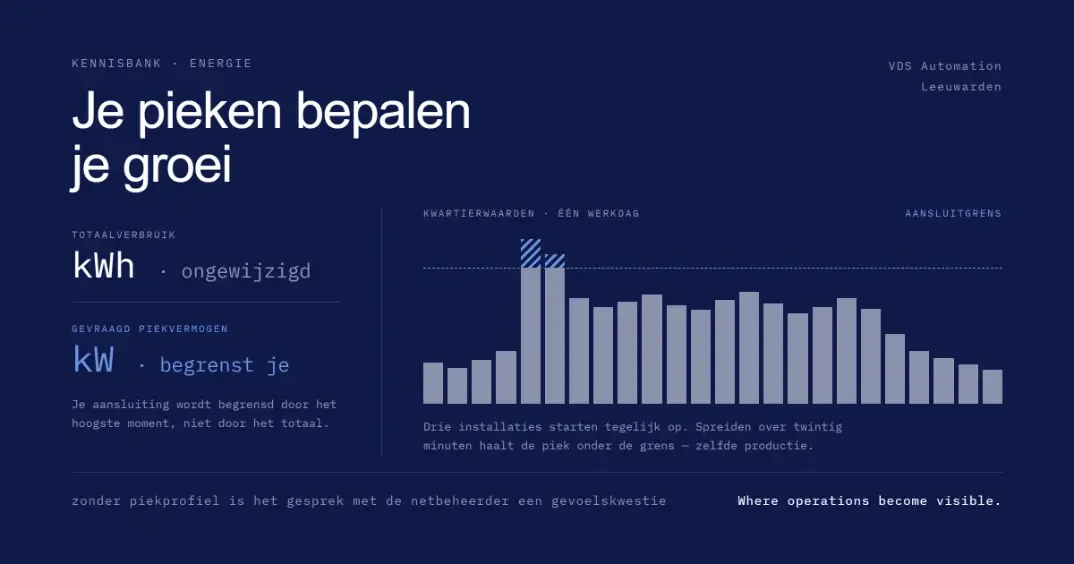 Knowledge base
Peak load and grid congestion: why your peaks determine your growth
Grid congestion is the shortage of transport capacity on the electricity grid that stops you getting a heavier connection; peak load is the highest power you draw at brief moments.
Read more → Knowledge base
Setting up energy monitoring in four steps
You set up energy monitoring in four steps: take stock of your energy flows and information needs, unlock the main meter data, add submetering at critical measuring points, and bring it all…
Read more → Knowledge base
Predictive maintenance: maintenance based on condition
Predictive maintenance is maintenance you carry out on the basis of the actual condition of a machine, measured with sensors, so that you step in just before a…
Read more →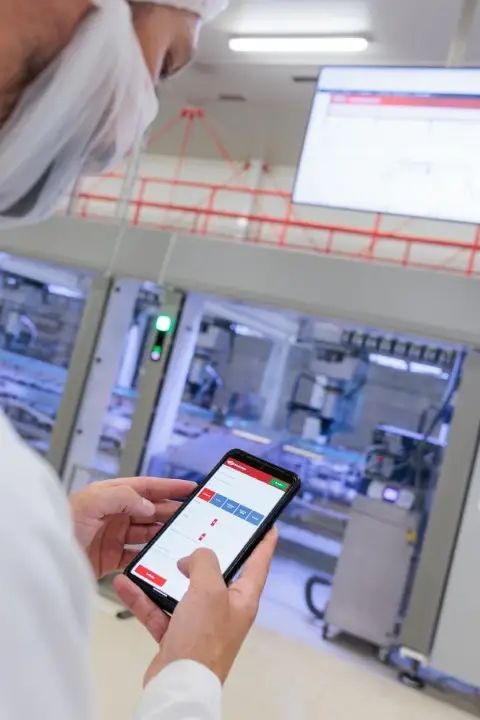 Knowledge base
Preventive versus predictive maintenance
You carry out preventive maintenance at fixed intervals, time or running hours, regardless of the actual condition; you carry out predictive maintenance on the basis of measured condition, exactly when it is needed.
Read more →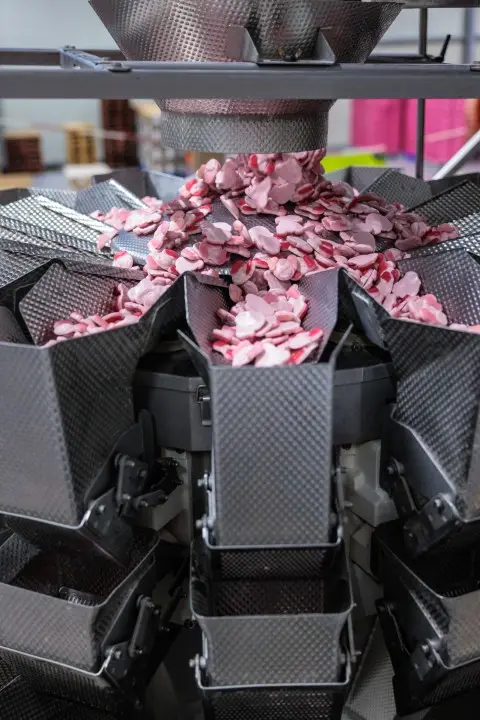 Knowledge base
TPM and autonomous maintenance
TPM (Total Productive Maintenance) is an approach in which operators and the maintenance department watch over machine condition together; autonomous maintenance is the part where operators themselves…
Read more →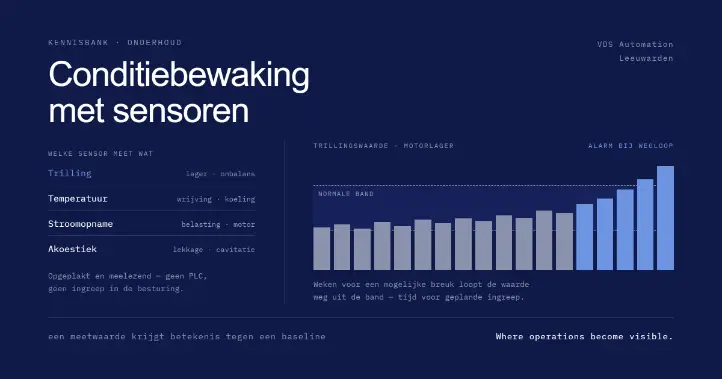 Knowledge base
Condition monitoring with sensors
Condition monitoring is the continuous measurement of the state of a machine with sensors, vibration, temperature, current draw, sound or speed, in order to see wear and emerging faults…
Read more → Knowledge base
Data ownership: your production data in your own Azure
At VDS your production data stays yours: it is stored in your own Microsoft Azure environment, under your own management and ownership, instead of in a supplier's platform.
Read more → Knowledge base
Secure OT connectivity: network segmentation and machine data
Secure OT connectivity means reading out machine data without mixing your production network (OT) and office network (IT): where possible the connection runs in one direction, via a…
Read more →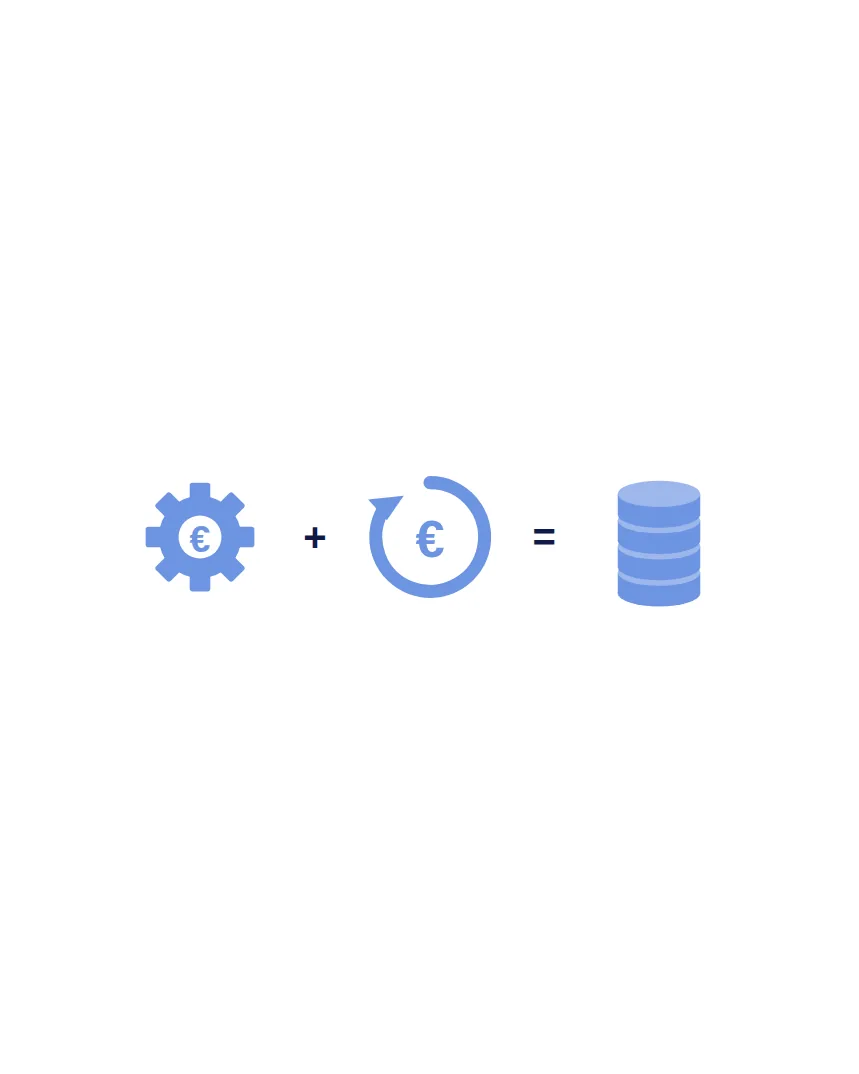 Knowledge base
What does a smart factory project cost? Structure, cost drivers and a worked example
Most smart factory projects start between €10,000 and €50,000: a one-off set-up plus a monthly subscription. Here is what decides where you end up.
Read more →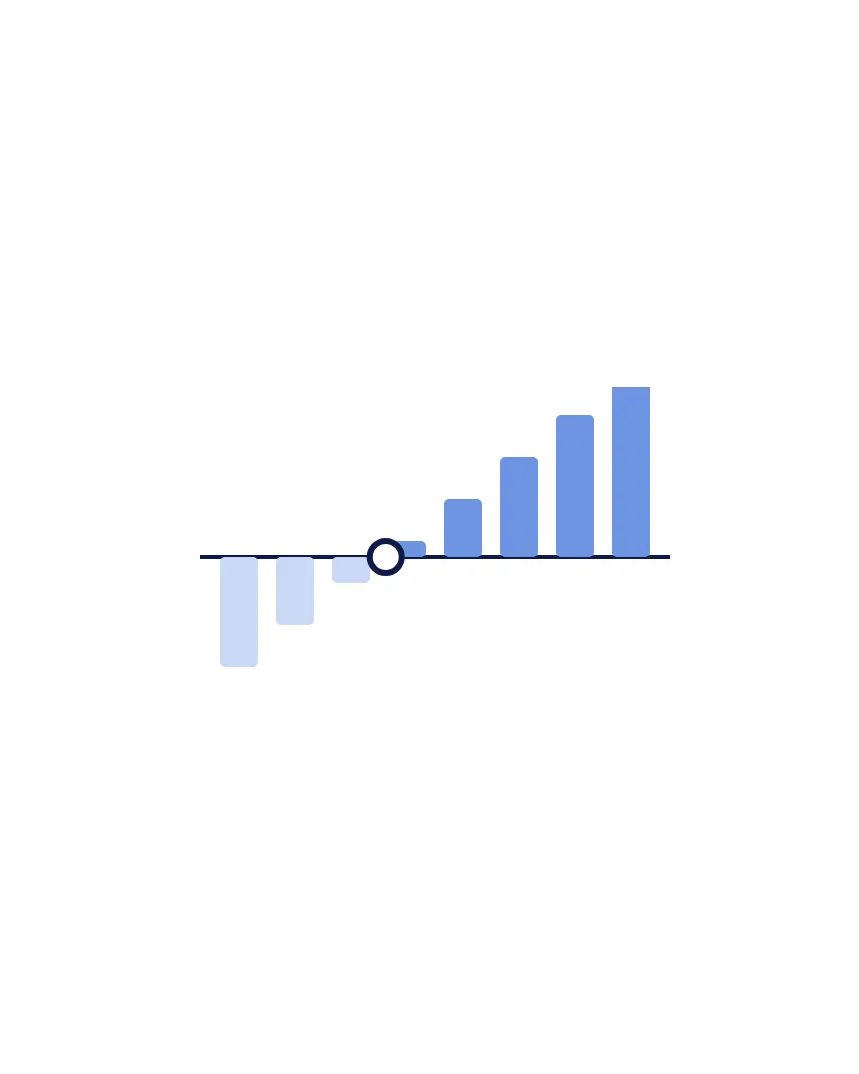 Knowledge base
Payback period of production data: how to work it out for your own line
You calculate the payback period of production data as investment ÷ annual saving. This is how to turn downtime, scrap and energy per line into euros.
Read more → Knowledge base
A business case for management: justifying OEE improvement in five blocks
A business case for OEE improvement answers five questions: what the loss costs, what can be recovered, what it costs, when it pays back and how you measure it.
Read more →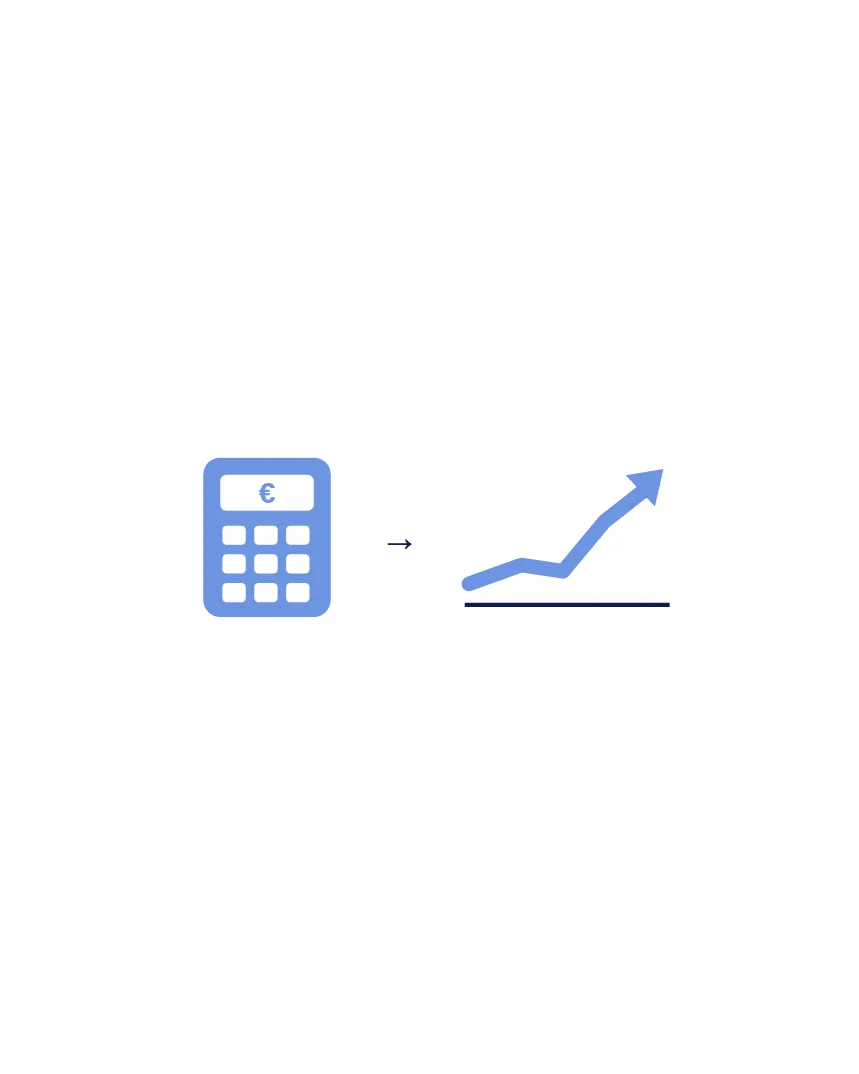 Knowledge base
ROI calculator: work out the payback period of production data
Work out how quickly an investment in production data pays back. Enter your hours, contribution margin and losses and see the payback period and return.
Read more →Curious what this means for your organisation?
Take the Smart Factory Check.
Ten questions, five minutes. An immediate score on four dimensions and a personal read on where you stand.