
Your energy bill is rising, but you do not know what is driving it.
Energy is one of the largest cost items in most factories, yet insight at machine level is usually missing. VDS Smart Factory makes consumption visible per source and per moment, so you can act on waste in a targeted way.
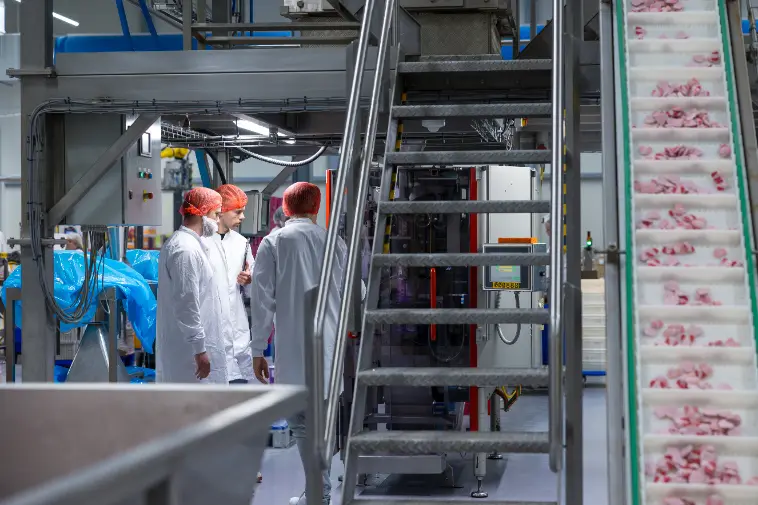
The energy bill looks backwards. Consumption happens now.
Most factories only find out afterwards what they have used. What they do not know: which machine peaked at 14:23 during a changeover, which shift consistently uses 12% more energy for the same product, or which compressor simply keeps running at night while nothing is being produced.
With grid tariff increases, contract limits and the EED audit obligation in the Netherlands on the horizon, "consumption per month" is no longer enough. You need consumption per machine, per shift and per product, and you need it before the peak.
Invisible peaks
A short peak during a changeover can push up your entire quarterly tariff, if you do not see it coming.
Consumption outside production
Compressors, cooling and compressed air that keep running during downtime too. Often 10–20% of the bill.
No link to the product
You know what a machine used. Not which product, which order or which recipe was behind it.
Grid congestion blocks growth, and without data you cannot make the case
You want to expand or become more sustainable, but you lack the peak profiles and consumption data at installation level that the grid operator and the EED audit ask for.
You pay afterwards for consumption that is happening now. Only when you see it at the moment itself can you change anything about it.
What insight into energy actually delivers.
Figures from our own projects and from research into energy monitoring in manufacturing. What you achieve depends on your machinery and your starting point. In a Quick Scan we run the numbers on your own figures.
Energy consumption from main meter to machine. In one view.
VDS combines measurements at installation, machine and process level with production data from ERP and MES. Consumption is linked directly to what was made, when and by which shift: the basis for saving as well as for reporting.
Predicted peak 15:50, 2.18 MW (limit 2.20). Recommendation: shift compressor 2 by 4 minutes.
Consumption per machine, shift and product
Real-time kWh consumption linked to production orders. Finally seeing what a product really costs to make.
Peak load in view
Peaks visible in real time, with alerts on contract limits. Avoid expensive tariff overruns.
Reporting without the Excel puzzle
Consumption data exportable per machine, shift and site, consistent and traceable. Ready for internal reporting, and for whatever legislation still has in store.
From recording consumption to staying ahead of it.
Only once you can predict and classify consumption can you really steer on it. AI in VDS Smart Factory learns your factory's consumption profile, spots waste that people do not see, and gives concrete recommendations before the peak shows up on the meter.
See peaks coming up to 30 minutes ahead
Based on the order portfolio, weather effects and historical profiles, the model predicts your expected consumption per quarter hour. Operators are alerted well in time when a contract limit is at risk.
"Why is this machine using energy in an empty shift?"
Models compare consumption with production status. As soon as a machine or installation draws energy without output, the system flags it as waste, together with the likely cause.
The real kWh cost price of every product
AI automatically allocates consumption to production orders, including warm-up, changeovers and idle running. Suddenly you know which product mix in which shift is the most energy-efficient.
This is what is in place after delivery.
Delivered ready to work with, including the evidence you need for the energy saving obligation in the Netherlands.
Your bill is a total. Your consumption is a pattern.
This is what a production day looks like once you measure per machine. An illustrative example; your own profile will differ.
Energy as a precondition for growth, sustainability and reporting.
Energy prices are volatile, the grid is full, and the energy saving obligation and EED audit obligation in the Netherlands call for verifiable data at installation level. Reports based on invoice data and assumptions are becoming harder to defend.
VDS gives you the factual foundation: consumption per installation, peak profiles per day and per week, and exportable data for management meetings, the grid operator and sustainability reporting. No promises of savings, but objective measurement data from which you draw the conclusions.
What that measurement looks like in practice, from submeter to dashboard, is on energy monitoring.
Read: how to build the case on grid congestion with data →
Example: most of a peak often comes from just one or two installations. As soon as that is visible, the conversation with the grid operator or the board becomes concrete.
Consumption says little without the rest of your production
Read more on this subject
Find out what you can save on energy.
Book a Quick Scan.
In half a day we look at your consumption data and show where the biggest energy gains sit, and how AI predicts peak load before it costs you money.