
More output from your existing factory.
Without new machines.
The biggest capacity reserve in your factory is not in extra machines, but in the hours you are already losing today. VDS Smart Factory makes hidden downtime, micro-stops and bottlenecks visible, and AI helps you predict them before they strike.
You know that capacity is leaking away. Not where, or why.
In most factories, downtime only becomes visible in the weekly report. By then the production of that week is already lost. Micro-stops of twenty seconds, a line that structurally runs at 85% instead of 95%, a changeover that takes every shift ten minutes longer than necessary: it does not stand out in the totals, but it costs you hours every day.
Operators do see it, but they do not record all of it. Planning works with assumptions about line speed. And management only sees afterwards what has happened.
Hidden downtime
Short stops that are not recorded, but together add up to a few per cent of your production time. Exactly what it is in your case is something a measurement will show.
Slow start-up
After every shift change or break it takes longer than necessary for the line to get up to speed.
Changeover time variation
The same changeover takes a different amount of time from shift to shift. Nobody knows why.
Unknown bottleneck
Which machine slows the whole line down shifts from product to product, but you only see it afterwards.
You do not have to buy a new line to produce more. Your extra capacity is already running, you just cannot see it yet.
Real-time OEE, with the context you need to steer.
VDS Smart Factory connects to your existing PLCs, sensors and ERP. Output, downtime and causes come together in one dashboard, per line, per shift, per product. No more assumptions, but current figures that both the shop floor and management can steer on.
Pattern recognised: micro-stop peak at 13:40, probably a blockage at the infeed. Similar cause on 11 March.
Real-time OEE per line
Availability, performance and quality live per machine, line or shift. Without manual recording.
Downtime recording with a reason
Operators record causes on a touchscreen, sensors measure the duration. Patterns become visible by themselves.
Shift and line comparison
A fair comparison based on product and conditions, not on who happened to be on the line.
Thousands of data points a minute.
No human can keep up with that.
You now have real-time data about your production. But no human can possibly compare, correlate and predict across thousands of data points a minute, 24/7. That is exactly what AI in VDS Smart Factory does for you.
Recognising deviations before they become downtime
Models learn what is normal for your machines, per product and per shift. As soon as vibration, speed or cycle time deviates structurally, the operator gets an alert. Before a micro-stop turns into a breakdown.
Seeing the next constraint coming, not once the line has stopped
In the morning you know which machine is likely to become today's bottleneck, before the shift starts. AI compares the order profile with historical line performance and flags where the pressure will build. Planning can redistribute while there is still time.
Not just what stopped, but why
Downtime reasons, sensor values and product data are correlated automatically. AI groups similar incidents and suggests root causes; improvement projects start with facts, not with opinions.
This is what is in place after handover.
With a single point of contact, from the hardware on the machine to the training of your operators.
What changes on the floor.
It is not the technology that makes the difference, but the moment you know something.
Before
- Downtime becomes visible in the weekly report, when the week is already over
- Micro-stops of twenty seconds are not recorded
- Planning works with an assumed line speed
- Why shift B achieves less is a discussion
- A capacity question leads straight to an investment proposal
After
- At 10:00 today you see what went wrong this morning
- Every stop is recorded, with duration and cause
- Planning works with the speed the line actually achieves
- Why shift B achieves less is a fact with a cause
- First you know how much capacity is still left in the line
From paper on the line to steering on data every day.
At CCI, one of the largest private-label confectionery producers in North-West Europe, downtime used to be kept on paper. Today every day starts with a day-start meeting based on the VDS dashboard. Downtime, causes and output are comparable between lines, and the finance department steers on actual cost price.
Read the full CCI story →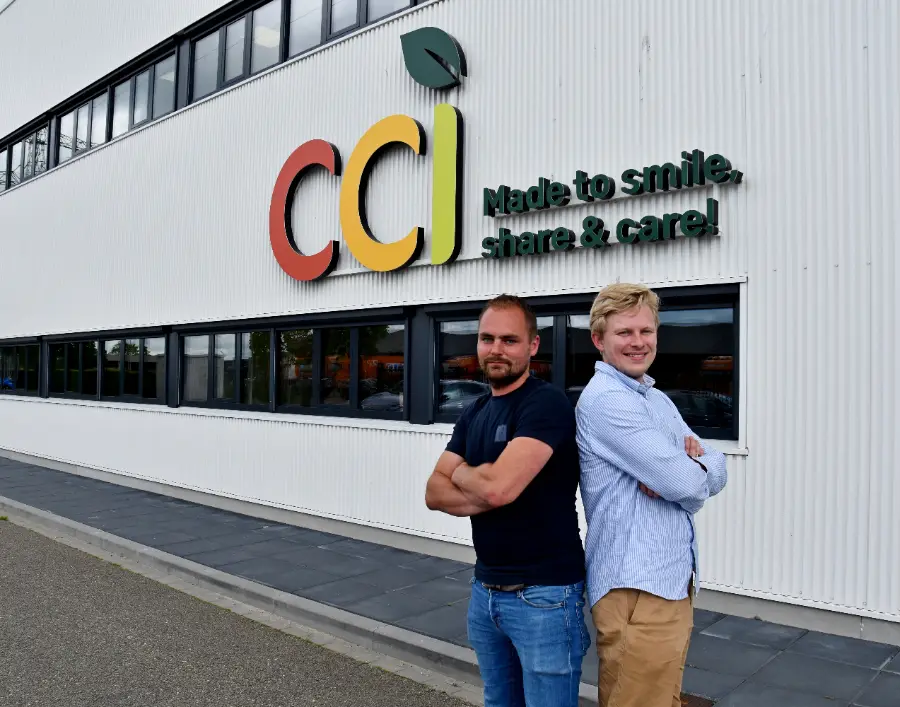
“We had to start working in a more fact-based way and make improvements on the basis of data.”
Winning back hours also affects your quality and your energy bill
Read more on this subject
Find out where your factory is losing capacity.
Take the Smart Factory Check.
Ten questions, five minutes. An immediate score on four dimensions and a personal read on where you stand.