
Production, HR, sales and finance. In one view.
The shop floor steers on lines and shifts. But the big decisions, investing, hiring, pricing, contracts, depend on the connection between departments. VDS brings production data together with planning, sales and finance, so that the board and the management team steer on one single source of truth instead of on four separate reports.
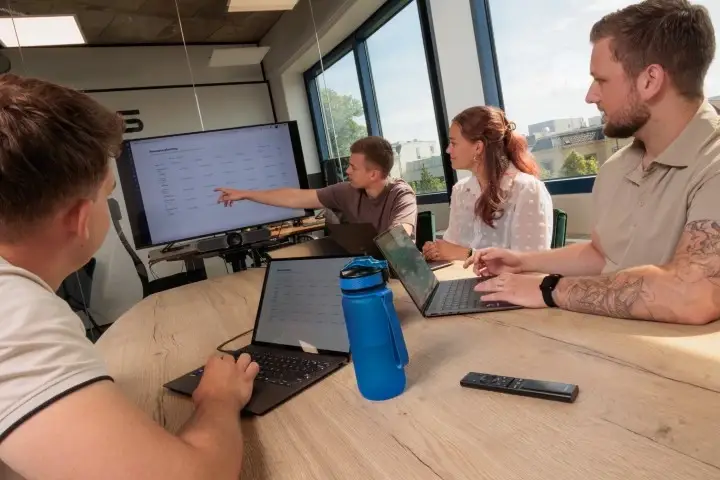
Every department has its own truth. The management team has to reconcile them by hand.
Production reports output, finance reports margin, sales reports orders and HR reports staffing. They are all correct, but each in its own system and its own format. Every month the management team lines those pictures up by hand, often in a spreadsheet, often too late.
As a result you steer on closed figures from last month, while the decisions, capacity, price, staff, are about the months ahead. The connection between departments, which is exactly where the steering information sits, stays invisible.
Four reports, no picture
Production, finance, sales and HR report separately. Nobody sees the connection at a glance.
Monthly figures, no steering
By the time the figures are in, the month is over. Adjusting is no longer possible.
Forecast separate from capacity
The sales forecast and the actual production capacity are rarely put side by side.
Deciding on gut feeling
Investing, hiring or pricing: big choices lean on experience, because the facts do not come together.
The other themes make one layer of your factory smarter. Company-wide control stacks those layers, so that the board steers the whole company from one view.
One single source of truth. For the whole boardroom table.
On top of your existing systems, ERP, production, time registration, finance, VDS builds one data model. That is where the departments come together, cleaned up and aligned. The management team looks at the same picture, at any moment, instead of at four versions of the truth.
Forecast for weeks 23–25 exceeds the planned staffing. If the planning stays unchanged, lead times will rise for 2 product groups.
Where two departments meet, steering information appears.
Production × finance
Actual cost price and margin per order, product and customer. Including scrap, changeover time and energy, and not only in the after-costing.
Production × sales
Sales forecast alongside actual capacity. See where demand outruns the line, before the lead time rises.
Production × HR & planning
Staffing and deployment alongside order pressure per line. Substantiate where you need people most, and when.
Energy × contracts
Consumption alongside purchasing contracts and tariffs. Shift heavy processes to favourable hours where you can.
The management team cannot calculate through four departments at once. AI can.
The value sits in the connection: what does a shift in the order book do to your staffing, your margin and your energy costs at the same time? AI works through those scenarios continuously, so that the board makes choices with the consequences already in view.
See the effect across departments
Shift the product mix, an investment or the planning, and the model shows in one go what that does to margin, capacity and staffing. Substantiation for the boardroom table, not a hunch.
Deviations that cross the departmental boundary
When sales, capacity and margin start to drift apart, that is visible before it reaches the monthly figures. Well in time to adjust.
Answers from one single source of truth
"Which product group grew fastest and held on to its margin?" The answer comes from the same model that the whole board uses, not from somebody's own spreadsheet.
This is what is in place after handover.
Delivered ready to work with, in your own environment, with roles and permissions per department.
Everyone looks at the same thing. Just not at the same view.
The discussion about whose figure is right disappears as soon as every view runs on the same measurement.
One single source of truth for the Board and the management team.
Kooi Camerabewaking steered on management information from several source systems: forecasting, financial control and operational reports, all separate. VDS built one scalable ETL environment with Power BI on top, so that the Board steers on one view and can test the strategy against the figures.
Read the full Kooi story →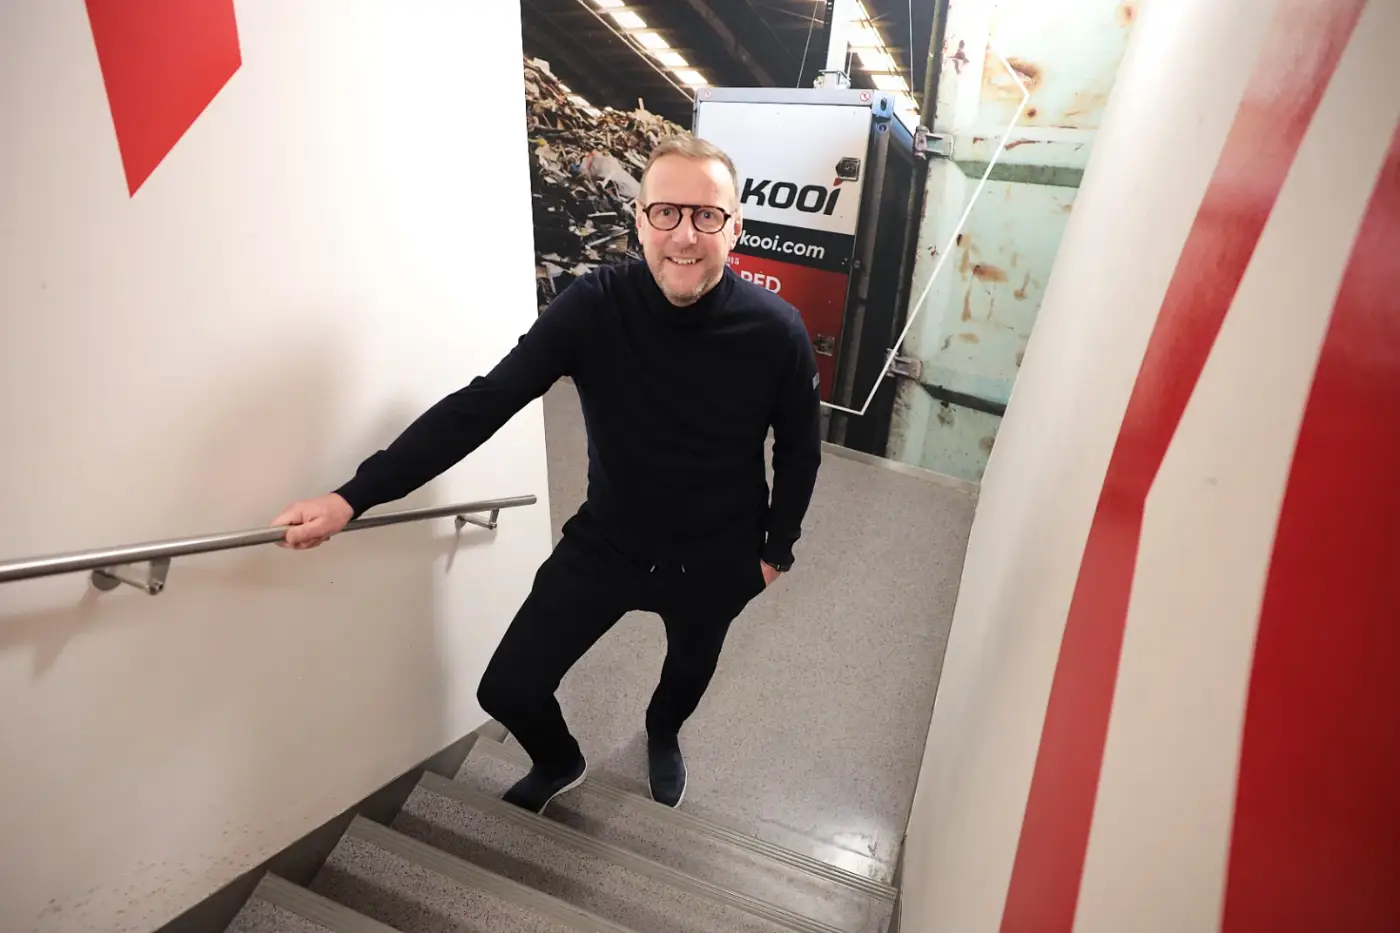
“For us VDS is a strategic partner that works at the interface of business and data, and relates those two to the strategy.”
The overview follows from the layers underneath.
Read more on this subject
Steer on the whole company, not on separate departments.
Book a Quick Scan.
In half a day we look at the systems behind your departments and show you what one single source of truth looks like for your boardroom table.