This is not a big-bang project. The pitfall is trying to measure everything at once; the gain lies in starting small at the measuring points with the most explanatory power and extending from there towards a closed energy balance.
Step 1, Taking stock
Start with the question, not with the technology: what do you need to be able to see, and why? Peak profiles for the conversation about grid congestion, consumption per installation for the energy saving obligation in the Netherlands, or comparisons between lines and shifts. That information need determines which data sources you need and which measuring points take priority.
Step 2, Unlocking the main meter data
The main meter data forms the baseline. It is unlocked via a secure connection, depending on your metering company and your situation, so that you have one consistent source for total consumption, peak and off-peak periods and historical comparisons, without manual export and import work.
Step 3, Submetering at critical measuring points
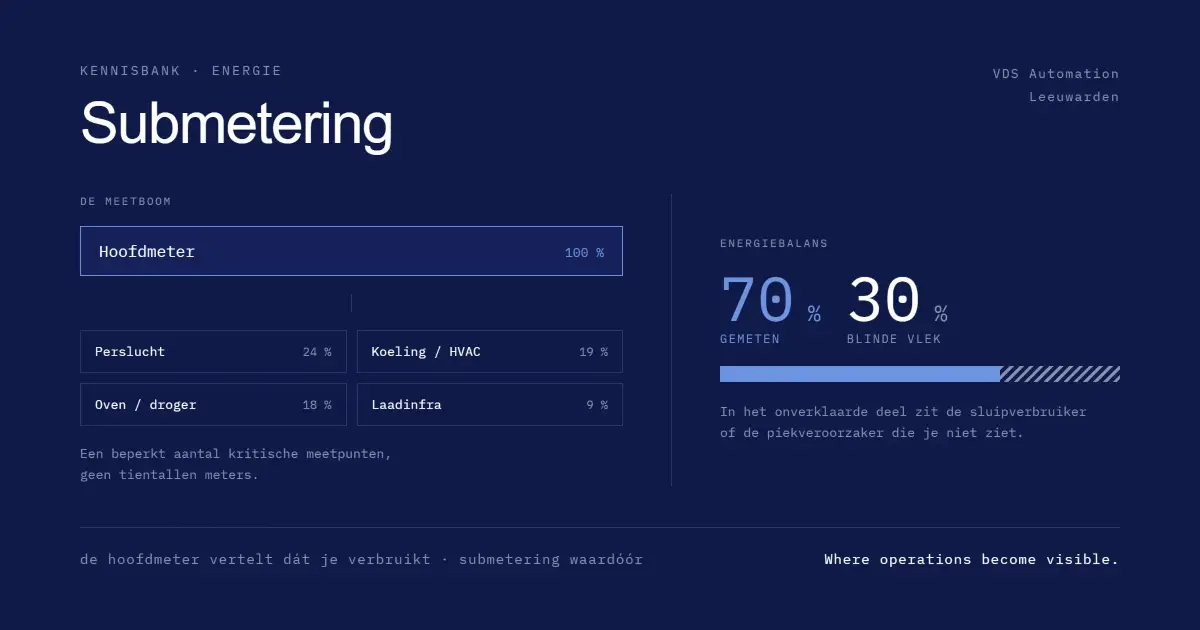
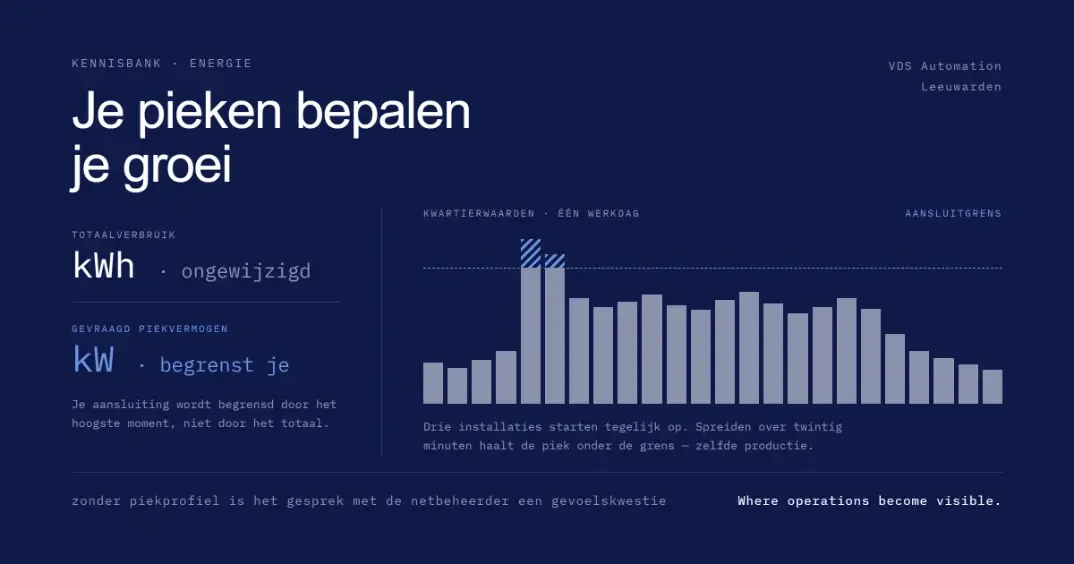
Where the main meter stops, explanatory insight begins. At the critical measuring points (compressed air, cooling, ovens, HVAC) you add submetering, so that you see which installations contribute to peaks and base load. You extend until the energy balance closes well enough for your purpose, and no further than necessary.
Step 4, Monitoring and analysis
All measurement data comes together in one dashboard with trends, peak profiles and deviations relative to a baseline. That can connect to an existing energy management system (EMS) or run in a VDS dashboard, depending on your situation. The data stays in your own environment.
Example from practice (illustrative)
You start with the main meter plus three submeters on the biggest consumers. Within a few weeks you have a first picture of peak and base load and you see where the blind spots are. On that basis you add two measuring points in a targeted way, and after a quarter the energy balance is closed far enough for you to substantiate measures, step by step, with a result after every step.
The division of roles
VDS supplies the measurement data and the analysis (patterns, trends, deviations). The interpretation, the root cause analysis and the measures stay with your organisation. That way energy monitoring remains a steering instrument in your hands, not a dashboard that gathers dust.
Frequently asked questions
How do you start with energy monitoring?
Small: first unlock the main meter and add submetering at the critical points, then extend in a targeted way until the energy balance closes well enough.
Do I need submetering?
For explanatory insight, yes: the main meter only shows the total, not what causes peaks and base load.
How long does setting it up take?
A first picture of peak and base load is often there within a few weeks of unlocking the main meter and the first submeters; after that you extend in phases.
Does it connect to my existing EMS?
Yes, the analysis can connect to an existing energy management system or run in a VDS dashboard, depending on the situation.
Who owns the data?
You do: the measurement data stays in your own environment; VDS supplies the measurement and the analysis, not the ownership.