The main meter tells you that you are consuming; submetering tells you what is causing it. That difference is exactly what you need to underpin a saving measure, explain a peak or cover a reporting obligation, all questions that stay unanswered at plant level.
The measurement tree: from main meter to critical measuring points
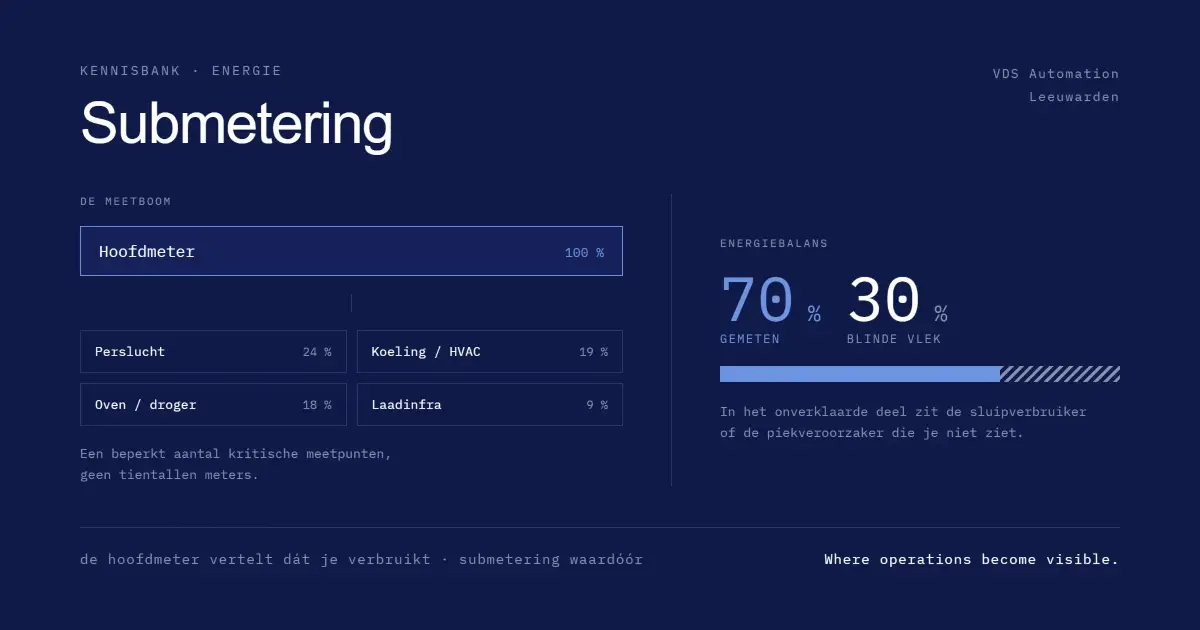
You do not have to meter everything. A measurement tree brings structure: the main meter at the top, and below it a limited number of critical measuring points that together cover the largest and most variable part of your consumption. That makes consumption traceable without installing dozens of meters.
The energy balance: how much are you really measuring?
The energy balance compares the sum of your submeters with the main meter. The difference is the not yet measured ('unmetered') part, the blind spot in your insight.
Example (illustrative). Main meter 100%, submeters together cover 70%. The remaining 30% is unexplained: that is where a standby consumer or a peak driver may sit that you cannot see today. Every measuring point you add shrinks that blind spot and increases the explanatory power.
Where do you start? Prioritising on explanatory power
Start with the installations that consume the most or vary the most, that is where a measurement delivers the most explanatory power per euro. In the manufacturing and process industry those are often:
- Compressed air/compressors: large, often underestimated consumers with clear peak patterns
- Cooling and HVAC: strongly dependent on season and time of day
- Ovens, dryers and heating processes: high start-up and peak load
- Charging infrastructure: growing, and a typical new driver of peaks
Practical example (illustrative)
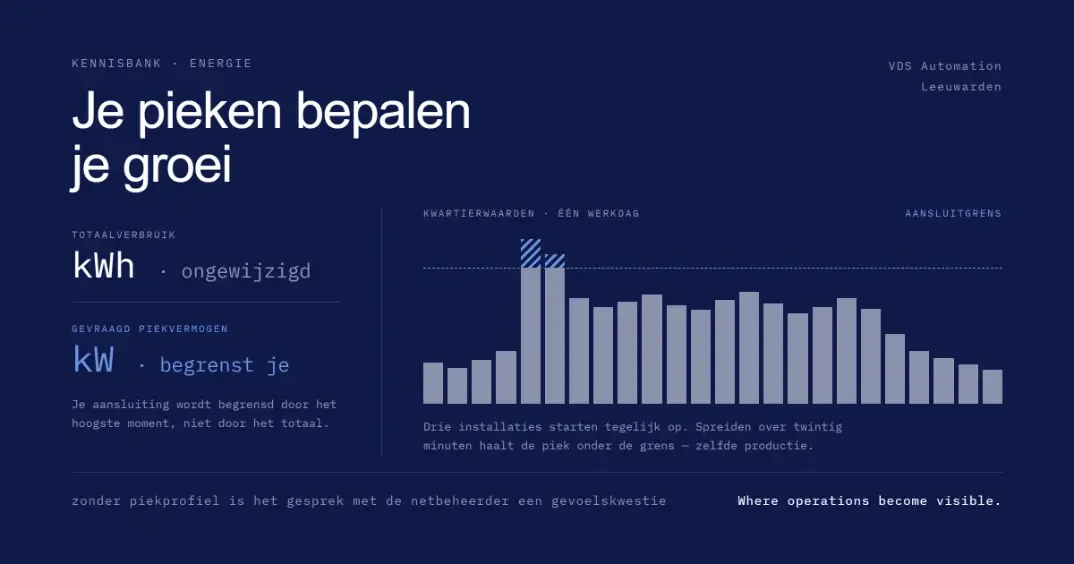
The main meter shows a peak every morning around 07:00, but you do not know what causes it. Submetering shows that the compressor for compressed air and the start-up of the oven coincide at that moment. The same peak in kW, but now explained, and therefore open to discussion: spread it over time, or start up in phases. The height alone did not give that direction.
How this underpins your energy saving obligation in the Netherlands
To demonstrate that a measure falls within the payback period and has had an effect, you need consumption at installation level, exactly what submetering delivers. That way submetering becomes not only insight but also evidence for the energy saving obligation in the Netherlands.
The division of roles stays sharp: VDS supplies the measurement data and the patterns (peaks, base load, deviations); the interpretation, the root cause analysis and the choice of measures lie with your organisation.
Frequently asked questions
What is the difference between a main meter and a submeter?
The main meter measures the total per connection; a submeter measures a sub-flow such as a line, installation or department, so that you see what the total is made up of.
Where do you start with submetering?
With the largest or most variable consumers, compressed air, cooling, ovens, HVAC, because those explain the peak and the base load best.
What is an energy balance?
The comparison of the sum of the submeters with the main meter; the difference is the not yet measured ('unmetered') part of your consumption.
How many submeters do I need?
As few as possible for as much explanatory power as possible: start with the critical measuring points and expand until the energy balance closes well enough for your purpose.
Does submetering help with the energy saving obligation in the Netherlands?
Yes. It supplies the consumption data at installation level that you need to calculate payback periods and to demonstrate the effect of measures.