
“We can now see much further than just the main grid connection”
How SMI gains more insight into the energy consumption of its production sites with energy monitoring from VDS.
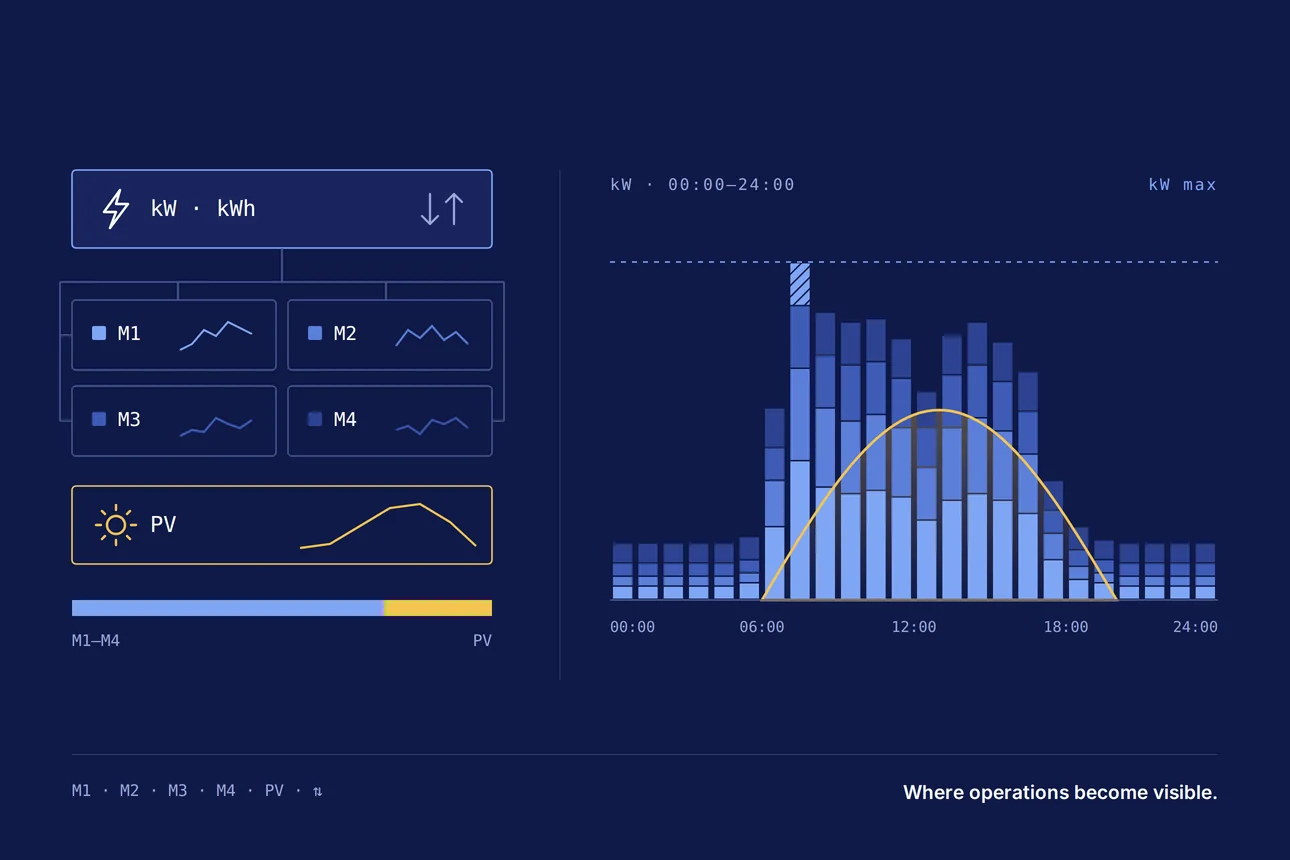
What happens to energy consumption when several machines start up at the same time? And how much of the solar power generated on site is actually used in the factory? For SMI Plaatwerk it became increasingly important to understand where energy consumption arises within production and which machines contribute to peak load. Together with VDS Automation, a solution was developed that makes consumption visible down to machine level.
Knowing what you actually consume
At SMI, a range of machines and installations run every day. From laser cutting and punching to press braking and welding: almost every step in the production process requires energy. But how much do those machines consume individually? And what happens when several installations are switched on at the same time?
For its energy data, SMI depended largely on the measurements at the grid connection. They did show how much electricity was drawn from the grid, but not how that consumption was built up inside the factory.
Peak load in particular was an important point of attention. When several machines start up at the beginning of the working day, energy demand can rise sharply in a short time. Without insight into where and when that happens, it is difficult to steer in a targeted way. All the more so as energy costs and the available capacity on the electricity grid become increasingly important concerns.
From the meter cabinet to the machine
VDS Automation helped SMI look beyond total electricity consumption. By installing additional energy meters at various points in the factory, the consumption of individual machines and installations is recorded.
Using VDS’s own IoT hardware, this data is collected and brought together in a Power BI dashboard. The data from the grid connection is added there too. The result is a far more detailed picture of energy consumption: from the total electricity drawn to the contribution of individual machines.
In the dashboard, SMI can look back at when peaks occur, which machines contribute most to them and how energy consumption develops over the course of the day.
A surprising insight into solar power
The new measurements reveal something else as well. SMI generates its own electricity with solar panels, but how much of it is used directly in the factory?
The grid meter records how much electricity is drawn from the grid and how much is fed back into it. SMI’s own measurements also show how much energy the machines actually use. Combining that data also gives insight into the solar power that is used directly within the business.
This makes it possible to understand total energy consumption better. Not only what comes in from outside, but also what the factory generates and uses itself.
Not just measuring, but understanding
For SMI, the value of the solution lies above all in the insight the measurements provide. Where previously mainly total consumption was visible, the company can now look much more specifically at energy demand within production.
The dashboard shows, for example, which machines are responsible for the greatest load at certain moments. That provides a basis for investigating whether processes can be organised differently and whether peaks can be reduced. By making this information available, VDS lays a foundation on which SMI can continue to build.
From one factory to several sites
Energy monitoring started at the production site in Leeuwarden. It has since been extended to the site in Dokkum as well. The solution thus grows with SMI’s need to make energy consumption visible across different locations.
Further expansion of the energy monitoring is also possible, for example by reading out additional installations and energy sources directly.
Insight as a basis for improvement
With energy monitoring, SMI has a much more detailed picture of its energy consumption than before. Not just the total, but precisely the distribution across machines, processes and moments becomes visible. That creates a valuable basis for looking more specifically at opportunities for optimisation. After all, if you know where energy is being used, you can also better determine where improvement is possible.
“Together with VDS we have taken a real step forward in making our energy consumption transparent. We can now see much further than just the main grid connection and see what is actually happening within our production.”Eelke Acronius, Process Engineer at SMI Plaatwerk
More stories from customers

CCI × VDS Automation
From paper on the line to daily steering on data. Downtime recording, dashboards and daily start-ups at a confectionery manufacturer with four factories.
Read the story →
Kooi × VDS Automation
One single source of truth for the Board and management team. ETL environment, Power BI and data warehouse, scalable for Kooi's growth.
Read the story →All success stories
See the overview of every collaboration, from food production to metalworking.
Go to the overview →Fancy sparring with one of our specialists yourself?
Book a Quick Scan.
No sales pitch, just someone with factory knowledge looking at it with you.