Management rarely asks whether a dashboard looks good. It asks when the money comes back. That is a fair question, and half a page of A4 is enough to answer it.
The formula
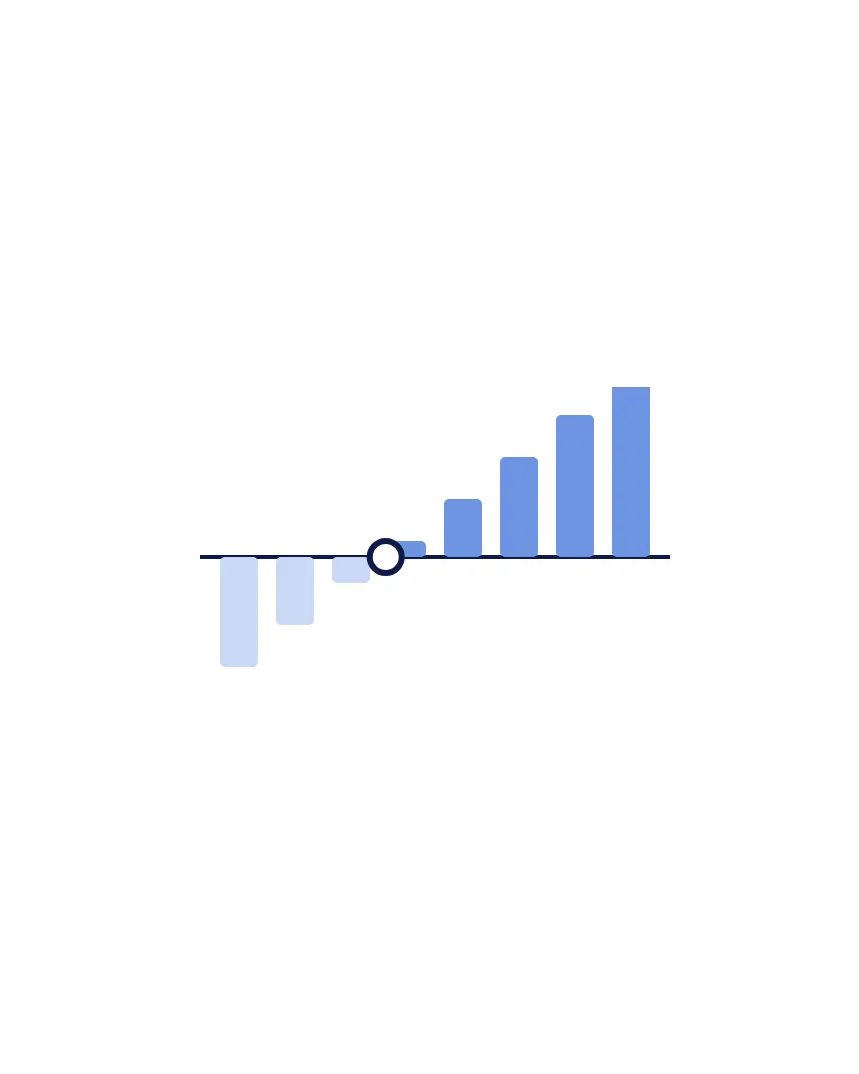
Payback period = one-off investment ÷ (annual saving − annual running costs)
Multiply the result by twelve to get months. Running costs are the subscription, the hosting in your own environment and the internal hours that remain structurally necessary.
Where the saving comes from
- Downtime. Hours that come back as production hours. Value them at the contribution margin per hour, not at revenue.
- Scrap and rework. Material, machine hours and labour that you currently throw away or do twice.
- Energy. Consumption outside production time, standby consumption and peaks that make your grid connection expensive.
There is a fourth item: the extra shift or line you can postpone because existing capacity is used better. It can be large, but it is the hardest to prove. Keep it out of the sums and mention it separately.
Worked example for one line
Say a line runs 4,000 hours a year on two shifts. Each production hour brings in €300 of contribution margin.
- Downtime: 3 OEE points back = 120 hours × €300 = €36,000
- Scrap: from 4% to 3% on €2 million of material value = €20,000
- Energy: 5% less on an energy bill of €150,000 = €7,500
- Saving: €63,500 a year
Set a one-off investment of €40,000 against that. Before running costs, it pays for itself in 40,000 ÷ 63,500 × 12 = just over 7 months. Deduct the running costs from your quote from the saving and you have the real payback period.
Also calculate with half
A business case that only works if everything goes right will not survive the first board meeting. So also calculate the version with half the saving: €31,750 a year, a payback period of just over 15 months before running costs. If the story still holds, you have a strong case.
Without a baseline it is a guess
The formula is simple. The hard part is the input. How much downtime do you have now, per cause? How much do you reject, per product? Pull that from Excel or from the shift supervisor’s memory and you are building a business case on quicksand. How to record that starting point is covered in taking a baseline measurement and proving the impact.
VDS supplies that measurement layer: downtime, counts and consumption straight from the machines, in your own environment. What you improve with the figures remains your decision. After six months you can then show what was actually recovered, instead of what was once promised.
Want to work it out with your own numbers? Use the ROI calculator.
Frequently asked questions
How do you calculate the payback period of an investment in production data?
Divide the one-off investment by the annual saving minus the annual running costs. The saving comes from less downtime, less scrap and lower energy consumption, valued in euros.
Do you calculate with revenue or with margin?
With contribution margin: revenue minus variable costs per production hour. Calculating with revenue makes the saving look unjustifiably large.
What is a normal payback period?
That depends on your losses, not on the software. A line with a lot of downtime pays back faster than a line that already runs tight. Work it out with your own baseline measurement.
Which costs do you include?
The one-off set-up and the running costs: the subscription, the hosting in your own environment and the internal hours that remain structurally necessary.
What if the saving is disappointing?
That is why you start on one line. The One-line concept delivers a working measurement after 6 to 8 weeks and, after 2 to 4 weeks of measuring, a report on which you can make a go/no-go decision.