

Manufacturing and process industry: data-driven production to a higher level
Manufacturing and process industry: data-driven production to a higher level
Real-time insights that enhance quality, speed, and OEE
Real-time insights that enhance quality, speed, and OEE
Manufacturing and process industry: data-driven production to a higher level
Real-time insights that enhance quality, speed, and OEE

Do you recognize these challenges in the manufacturing and process industry?
Unscheduled downtime or outdated assets
Labor shortages or knowledge loss on the shop floor
Quality variation, scrap or (near) misses
Fragmented data or pilots that do not scale
Traceability of ESG reporting

Do you recognize these challenges in the manufacturing and process industry?
Unscheduled downtime or outdated assets
Labor shortages or knowledge loss on the shop floor
Quality variation, scrap or (near) misses
Fragmented data or pilots that do not scale
Traceability of ESG reporting
Do you recognize these challenges in the manufacturing and process industry?
Unscheduled downtime or outdated assets
Labor shortages or knowledge loss on the shop floor
Quality variation, scrap or (near) misses
Fragmented data or pilots that do not scale
Traceability of ESG reporting


Less downtime. Better quality. Complete traceability.
Real-time management with a single platform for Analytics, Automation, and IoT.
Trusted by international clients


Trusted by international clients
Trusted by international clients
Increase OEE, reduce downtime, and make your factory ESG-proof.
The pressure on production costs, speed, and compliance is increasing. VDS Automation helps factories operate faster, safer, and more predictably with scalable solutions that deliver proven results.
The pressure on production costs, speed, and compliance is increasing. VDS Automation helps factories operate faster, safer, and more predictably with scalable solutions that deliver proven results.
Uptime & maintenance
Predicts failures and reduces downtime with data-driven maintenance.
Predicts failures and reduces downtime with data-driven maintenance.
OEE platform
Displays real-time OEE and bottlenecks so you can manage the line flow.
Displays real-time OEE and bottlenecks so you can manage the line flow.
Quality
Monitors quality inline with SPC for less rework.
Monitors quality inline with SPC for less rework.
Traceability & data
Connects shop floor, MES, and ERP data for complete traceability.
Connects shop floor, MES, and ERP data for complete traceability.
Energy & sustainability
Measures energy per asset and reduces kWh per unit and costs.
Measures energy per asset and reduces kWh per unit and costs.
Uptime & maintenance
From putting out fires to predictable maintenance.
Uptime starts with predictability. We read condition data such as vibration, temperature, current, and pressure directly and combine that with failure records and maintenance logic. Deviations are detected early, allowing you to move from firefighting to condition-based and even predictive maintenance. In the dashboard, you track machine statuses, causes, and trends in Mean Time Between Failures (MTBF) and Mean Time To Repair (MTTR) per asset or line, while your maintenance backlog and SLAs are automatically synchronized with your CMMS, such as Ultimo or Maximo. This way, you schedule parts and technicians based on actual risk and reduce the time between reporting and resolution.
Uptime starts with predictability. We read condition data such as vibration, temperature, current, and pressure directly and combine that with failure records and maintenance logic. Deviations are detected early, allowing you to move from firefighting to condition-based and even predictive maintenance. In the dashboard, you track machine statuses, causes, and trends in Mean Time Between Failures (MTBF) and Mean Time To Repair (MTTR) per asset or line, while your maintenance backlog and SLAs are automatically synchronized with your CMMS, such as Ultimo or Maximo. This way, you schedule parts and technicians based on actual risk and reduce the time between reporting and resolution.


OEE platform
Real-time OEE as a control tool for capacity.
OEE becomes a practical control instrument for us. Availability, performance, and quality come together in one continuous view, with a clear A/P/Q breakdown per line or cell. Deviations from the target cycle are immediately visible and can trigger an Andon alert or workflow where needed. Digital work instructions facilitate changeovers according to SMED principles, allowing for faster and more consistent transitions. Additionally, line balancing helps to harmonize staffing and cycle times and to accurately locate the real bottleneck. You can compare shifts and locations using the same metrics, making best practices easily deployable. As an operator, you receive real-time information about the production line, including the OEE. With downtime registration and work instructions on a tablet, you have maximum control over the process.
OEE becomes a practical control instrument for us. Availability, performance, and quality come together in one continuous view, with a clear A/P/Q breakdown per line or cell. Deviations from the target cycle are immediately visible and can trigger an Andon alert or workflow where needed. Digital work instructions facilitate changeovers according to SMED principles, allowing for faster and more consistent transitions. Additionally, line balancing helps to harmonize staffing and cycle times and to accurately locate the real bottleneck. You can compare shifts and locations using the same metrics, making best practices easily deployable. As an operator, you receive real-time information about the production line, including the OEE. With downtime registration and work instructions on a tablet, you have maximum control over the process.
Quality
From sampling to continuous quality monitoring
Inline quality checks with sensors, weighing and measurement signals, and code/label scans validate products during the process and provide immediate insight into trends and origins for each type of error. Statistical process control (SPC) monitors critical parameters; as soon as limits are exceeded, the operator receives targeted instructions or an automatic notification is sent. The result: less rework, higher first-pass yield, and demonstrable traceability for audits and customers.
Inline quality checks with sensors, weighing and measurement signals, and code/label scans validate products during the process and provide immediate insight into trends and origins for each type of error. Statistical process control (SPC) monitors critical parameters; as soon as limits are exceeded, the operator receives targeted instructions or an automatic notification is sent. The result: less rework, higher first-pass yield, and demonstrable traceability for audits and customers.


Traceability & data
Full traceability, from component to end product.
Complete traceability requires a solid data chain. Through an IIoT layer, we access PLCs, SCADA systems, and machines. ERP and PLM provide item and revision data, so you can see exactly which components, process parameters, and test results correspond to each serial number or batch. The production dashboard displays the entire process in the factory and simultaneously monitors data quality: missing values, outliers, and delays are highlighted. This reduces the likelihood of errors and speeds up analyses while meeting internal and external reporting requirements.
Complete traceability requires a solid data chain. Through an IIoT layer, we access PLCs, SCADA systems, and machines. ERP and PLM provide item and revision data, so you can see exactly which components, process parameters, and test results correspond to each serial number or batch. The production dashboard displays the entire process in the factory and simultaneously monitors data quality: missing values, outliers, and delays are highlighted. This reduces the likelihood of errors and speeds up analyses while meeting internal and external reporting requirements.
Energy & sustainability
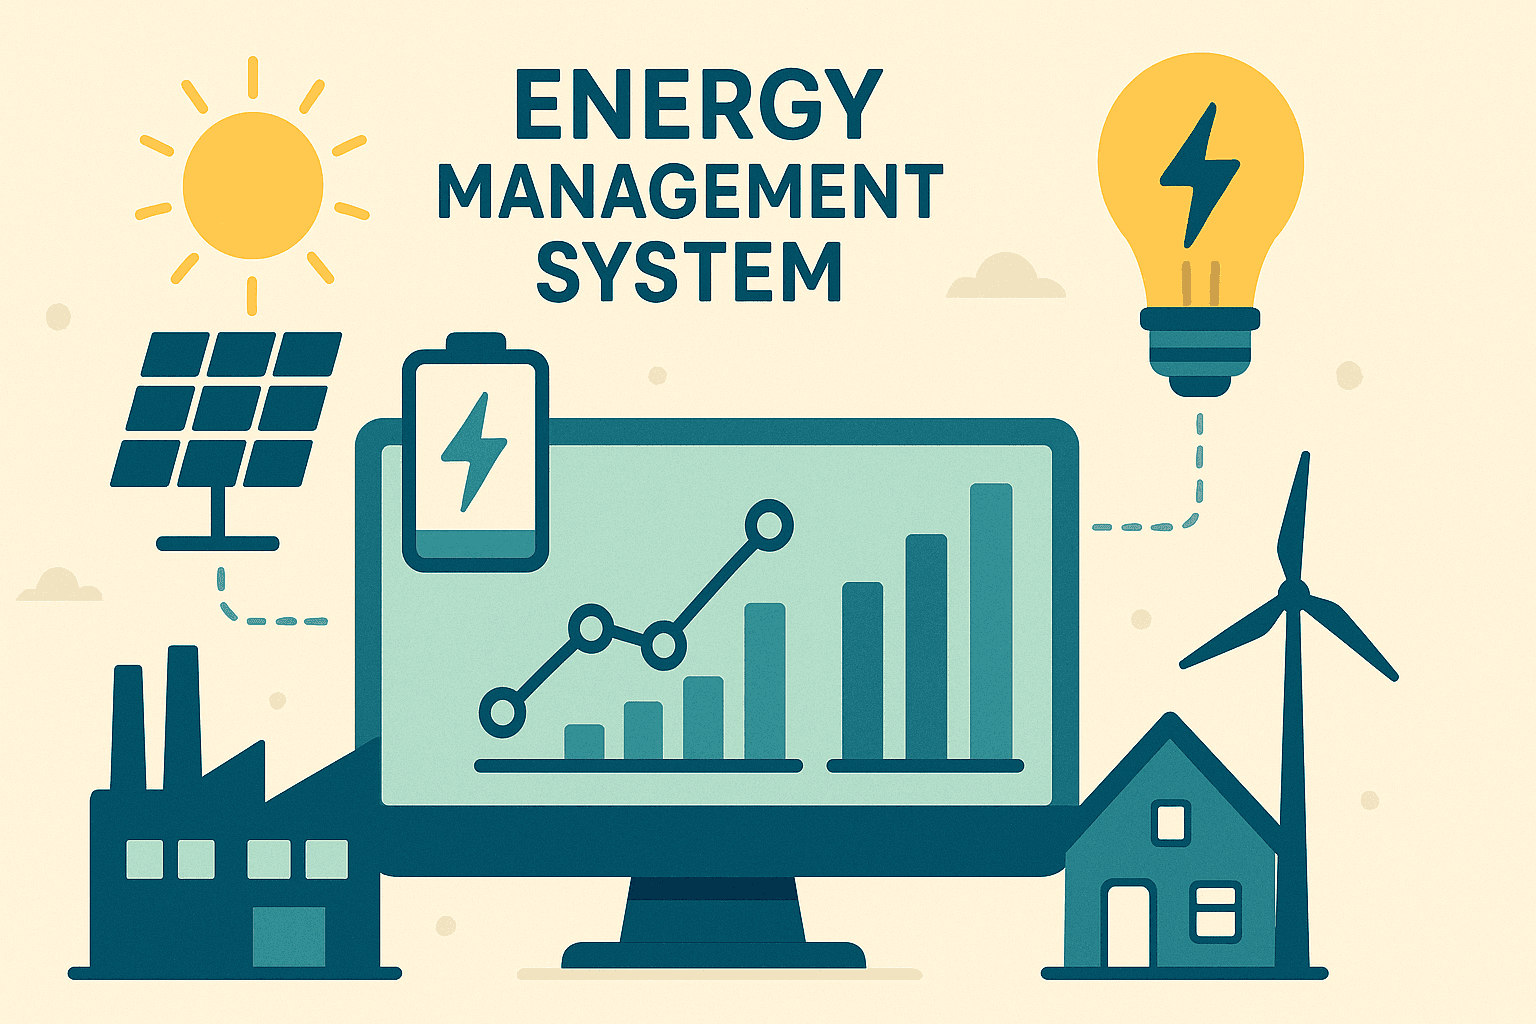
Energy insight from building to machine
We make energy performance concrete from building to machine. Submetering on separate installations, such as chillers and pumps, gives you visibility into consumption and efficiency per asset. Because consumption data is linked to orders, batches, or products, you can track kWh per unit and address peaks specifically. The dashboard signals unusual profiles and peak loads, allowing you to implement corrective actions immediately. Exports seamlessly align with ESG or sustainability reports, enabling you to share substantiated results without additional administration.
We make energy performance concrete from building to machine. Submetering on separate installations, such as chillers and pumps, gives you visibility into consumption and efficiency per asset. Because consumption data is linked to orders, batches, or products, you can track kWh per unit and address peaks specifically. The dashboard signals unusual profiles and peak loads, allowing you to implement corrective actions immediately. Exports seamlessly align with ESG or sustainability reports, enabling you to share substantiated results without additional administration.

Discover our solutions in the manufacturing and process industries
Discover our solutions in the manufacturing and process industries
Discover our solutions in the manufacturing and process industries


From our blog
From our blog
Read related blog posts
Read related blog posts
Blog
Analytics
EMS and GACS from 2026: what changes, who it affects, and how to prepare
Dec 12, 2025

Blog
Analytics
Energy monitoring: what is it, what can you do with it, and how do you implement it?
Nov 26, 2025

Blog
Analytics
From KPIs to concrete steering
Nov 7, 2025

Blog
Analytics
Self-service BI: smart outsourcing to your own key users (or not)
Oct 15, 2025

Do you want to know more?
Contact us and discover what VDS can mean for your organization.

Do you want to know more?
Contact us and discover what VDS can mean for your organization.
Do you want to know more?
Contact us and discover what VDS can mean for your organization.