

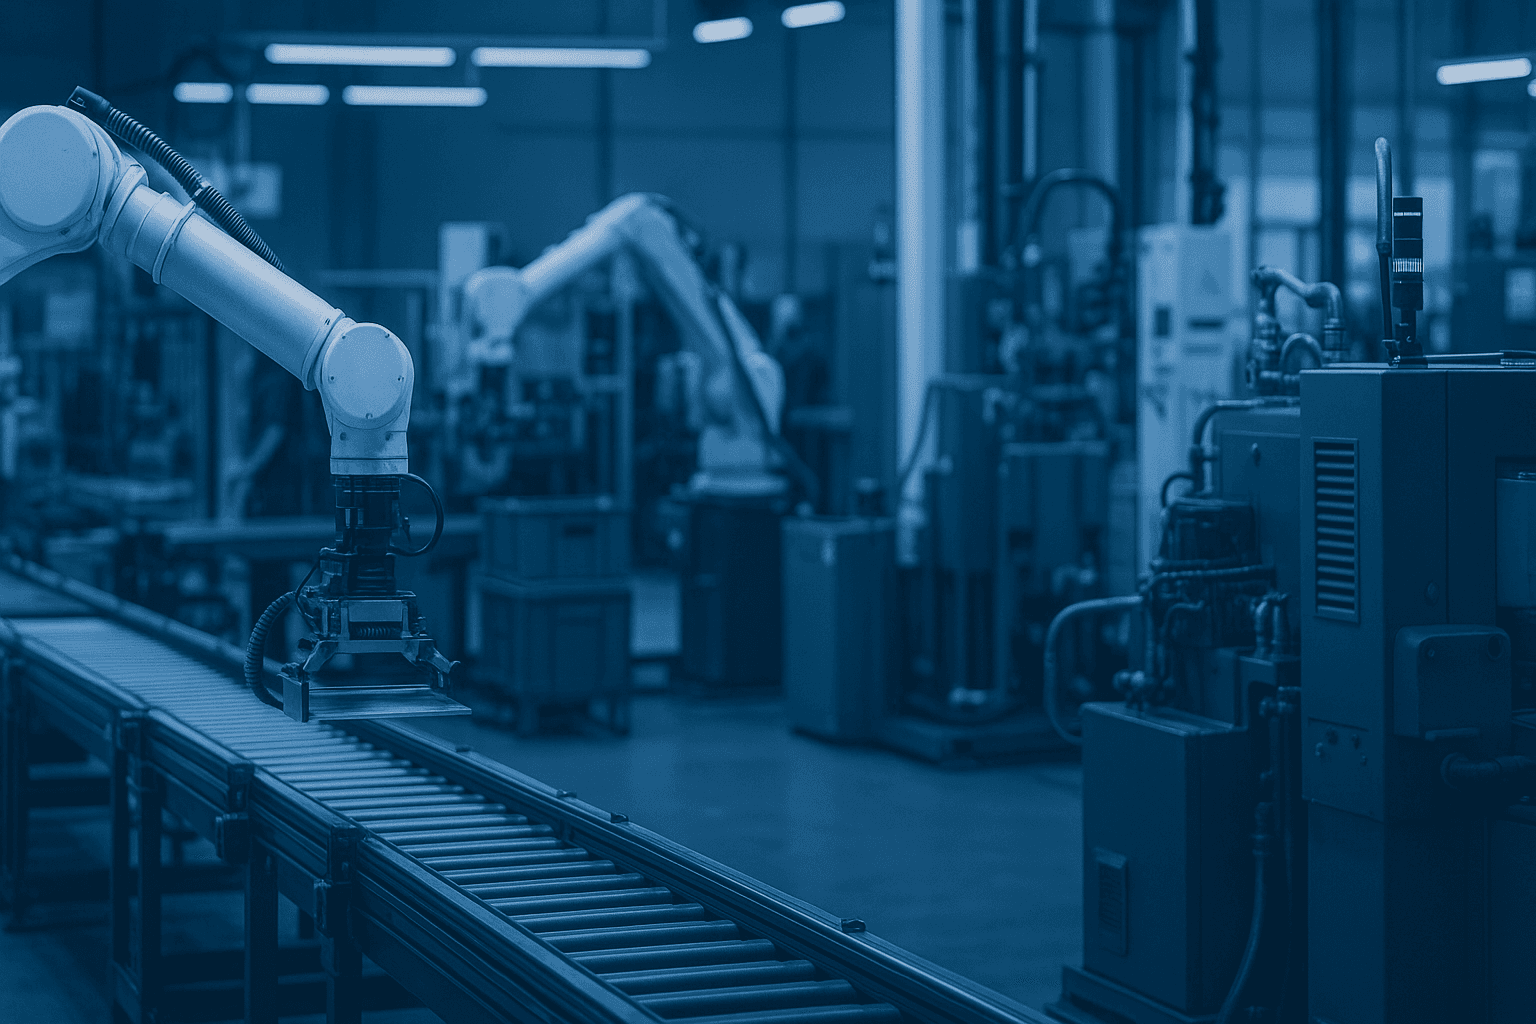
Increase your output and reduce waste
Real-time insights and analysis as a basis for better decisions about output, efficiency, and reliability.
Increase your output and reduce waste
Real-time insights and analysis as a basis for better decisions about output, efficiency, and reliability.


How can VDS Smart Factory support your organization?
In many production environments, performance only becomes visible when output has already been lost. Insight is fragmented, which puts figures into question and delays decision-making. The result is that improvements remain reactive, and the same disturbances keep recurring.
VDS Smart Factory brings real-time production performance and operational context together in one dashboard, so deviations during the shift are immediately visible. This way, you can respond faster on the shop floor and support your decisions at the management level.
Trusted by international clients


Trusted by international clients
From production performance to targeted action
From production performance to targeted action
Structurally managing production performance requires up-to-date and reliable insight into where and why performances deviate. Without this overview, problems remain visible late and optimization remains reactive.
The dashboard within VDS Smart Factory combines performance and operational context in one overview. Deviations become immediately visible and can be used for adjustments on the shop floor and decision-making at the management level. This insight simultaneously forms a basis for predictive maintenance, as trends and deviations are recognized at an early stage.
This insight is fed by data from various sources within the production environment and the existing IT architecture, including:
OPC UA
Modbus TCP / RTU
Digital I/O (such as pulse counters and motion detection)
Analog signals (including temperature, weight, and distance)
API connections
ERP, MES, and SCADA systems
By bringing these sources together, a consistent and up-to-date picture emerges, allowing deviations to be directly translated into targeted actions, for example when determining priorities during the daily start.
Sensors
Applications
Dashboards
Sensors
Applications
Dashboards
Discover our solutions within your sector
Discover our solutions within your sector
Discover our solutions within your sector

Voedsel
See deviations and performance loss while your production is running.
See deviations and performance loss while your production is running.
See deviations and performance loss while your production is running.

Feed
Define variations and bottlenecks in your production lines as they arise.
Define variations and bottlenecks in your production lines as they arise.
Define variations and bottlenecks in your production lines as they arise.

Chemical industry
See below under which process conditions performance deviates, even within acceptable limits.
See below under which process conditions performance deviates, even within acceptable limits.
See below under which process conditions performance deviates, even within acceptable limits.


Metal industry
Compare performance between machines and orders, despite differences in configuration.
Compare performance between machines and orders, despite differences in configuration.
Compare performance between machines and orders, despite differences in configuration.
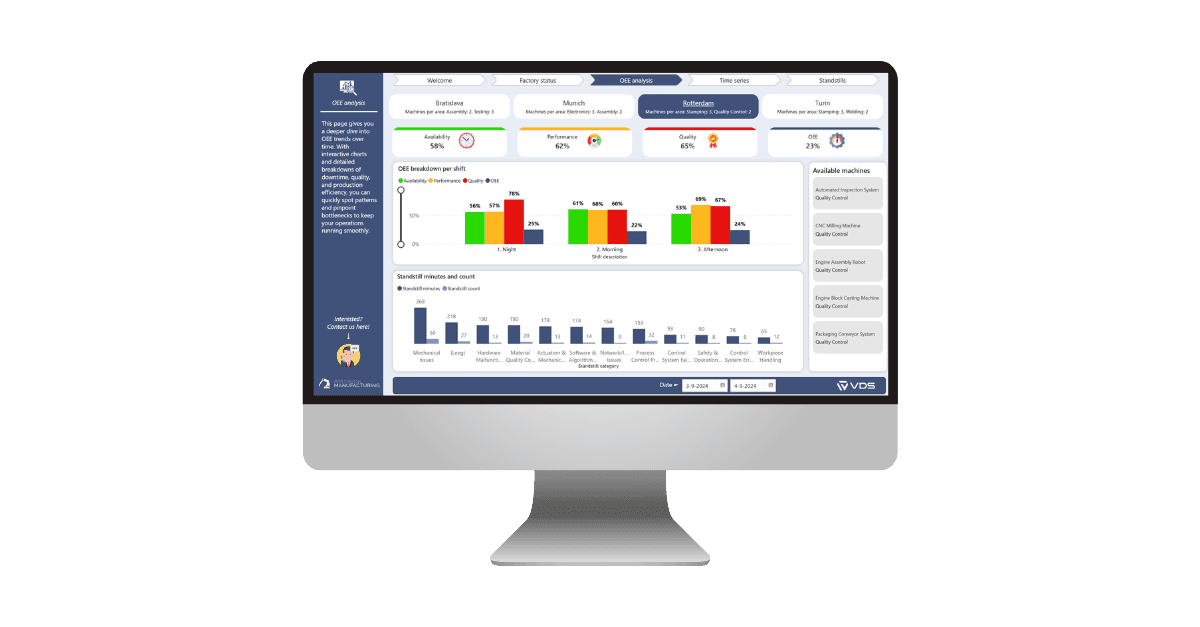

This is what structural performance management looks like in practice.
This practical example illustrates how real-time performance insight is used to steer daily operations. This insight forms the basis for structural OEE management and simultaneously provides entry points for predictive maintenance, as deviations and trends become visible early on. This allows teams to quickly understand what is happening and take targeted actions. As a result, it is immediately clear during the shift where performance loss occurs and what this means for planning and output.
This practical example illustrates how real-time performance insight is used to steer daily operations. This insight forms the basis for structural OEE management and simultaneously provides entry points for predictive maintenance, as deviations and trends become visible early on. This allows teams to quickly understand what is happening and take targeted actions. As a result, it is immediately clear during the shift where performance loss occurs and what this means for planning and output.
More results, less hassle: our approach
VDS combines business insight with technical depth. We understand how production processes function and how decisions are made on the shop floor and in management. As a result, we do not provide standalone solutions, but an approach that supports Continuous Improvement and ensures structural performance enhancement.
We take complex data and IT projects completely off your hands, allowing your team to focus on operations. Independent of vendors and platforms, with ownership by the client and always focused on what demonstrably adds value.
Within 4–8 weeks, we will achieve a first working basis for structural performance management.
How do you implement Smart Factory with VDS?
How do you implement Smart Factory with VDS?

Inventory
We map the production environment and distinguish between symptoms and structural causes. This clarifies where performance is truly lost and where management makes a difference.
We map the production environment and distinguish between symptoms and structural causes. This clarifies where performance is truly lost and where management makes a difference.

Data collection
We unlock relevant signals from machines, operators, and existing systems, and capture them reliably. This forms a consistent basis for insight, without extra actions on the shop floor.
We unlock relevant signals from machines, operators, and existing systems, and capture them reliably. This forms a consistent basis for insight, without extra actions on the shop floor.

Insight & analysis
By combining data, real-time insights into performance and causes are created. These insights are used in dashboards and daily starts to make targeted adjustments.
By combining data, real-time insights into performance and causes are created. These insights are used in dashboards and daily starts to make targeted adjustments.
Food
Food
Daily management in food production demands consistency in performance, while variation in processes and circumstances is unavoidable. Without up-to-date insight, management quickly focuses on averages, leaving deviations per product, batch, or moment underexposed.
VDS Smart Factory supports organizations in achieving operational excellence by making performance more comparable and making deviations visible in a timely manner. This creates structural control over quality, output, and delivery reliability, rather than reactive adjustments.

Feed
Feed
Performance loss in the animal feed industry is often explained by variation in the process, causing structural reasons to remain under the radar. Decisions are then made based on assumptions, while differences in settings, composition, and conditions are precisely determinant for the outcome.
We bring structure to this variation by making performances comparable. This makes it visible where variation is acceptable and where structural loss occurs, without extra registration or pressure on the operation.
Chemical industry
Chemical industry
In a Smart Industry environment, process control depends on insight into what is actually happening within process boundaries. Performance issues in chemical production often go unnoticed as long as deviations fall within seemingly acceptable margins.
VDS Smart Factory makes it visible under which process conditions performance deviates and structurally brings these patterns to light. This makes it possible to base decisions on settings, recipes, and process boundaries on actual performance effects instead of assumptions.
Metal industry
Metal industry
Differences between machines, products, and setup times make it difficult to compare performances fairly and consistently. As a result, structural losses often remain hidden behind operational variation.
We record performances clearly per machine, order, and product type, so that variation is no longer an excuse but provides insight. This makes it visible where capacity is structurally lost and allows for targeted management of utilization, instead of temporary solutions.
Frequently asked questions
Frequently asked questions
Which machines and systems can you connect with?
We unlock data from machines and controls as well as from your existing IT environment. Think of OPC UA, Modbus TCP/RTU, digital and analog signals, API connections, and integrations with ERP, MES, and SCADA systems.
What results can I expect?
You will gain faster and more reliable insight into where performance deviates and why. This allows you to intervene earlier during the shift, reduce waste, and better substantiate improvement actions. In the long run, this also forms a basis for recognizing trends and deviations that are relevant for predictive maintenance.
Can we also start with a pilot?
Yes. We often start with a pilot to quickly prove value with a defined scope, such as one line, one machine group, or one KPI set (e.g., OEE and the largest losses). In the pilot, we unlock the relevant signals, build an initial dashboard, and test together whether the insights are immediately usable for adjustments (for example, in the daily start). After that, you can scale up in a controlled manner to more lines, locations, or use cases.
How do you handle my data?
Om een video aan uw site toe te voegen, klikt u op de knop "Invoegen" en navigeert u naar de sectie "Media". Sleep vervolgens een videocomponent naar het canvas.
From our blog
From our blog
Read related blog posts
Read related blog posts


Ready to send with real-time insights?
Contact us and discover what VDS can do for your organization in the field of Smart Factory.

Ready to send with real-time insights?
Contact us and discover what VDS can do for your organization in the field of Smart Factory.